If SOXL’s swings have become uncomfortable, USD can look like a gentler version: two times semiconductor stocks instead of three. That comparison misses a crucial question. Two times which portfolio? A lower fund multiplier can coexist with far greater exposure to a single company.
USD here means ProShares Ultra Semiconductors, not US-dollar cash. We checked the official product pages on October 31, 2026 and aligned index weights to September 30. These are dated weights, not permanent portfolio characteristics.
SOXL and USD target different semiconductor indexes
← Swipe to view the full table →
| Feature | USD | SOXL |
|---|---|---|
| Issuer | ProShares | Direxion |
| Daily target | +2x index return | +3x index return |
| Benchmark | Dow Jones U.S. Semiconductors Index | NYSE Semiconductor Index |
| Index constituents, Sep 30 | 37 | 30 |
| Comparison needed | Company concentration | Composition plus daily leverage |
An industry label does not guarantee identical company selection or weights. Index eligibility and weighting methods can produce very different portfolios within semiconductors. The relevant sources are the ProShares USD product page and Direxion’s SOXL/SOXS page.
Both multiples describe a single day before fees and expenses. Neither promises an exact multiple of an index over a month or year. Daily compounding, financing, costs and tracking differences remain relevant for a 2x fund. It is not a cash substitute or an ordinary unleveraged sector holding.
Use the same date to compare NVIDIA concentration
← Swipe to view the full table →
| Company | USD benchmark | SOXL benchmark |
|---|---|---|
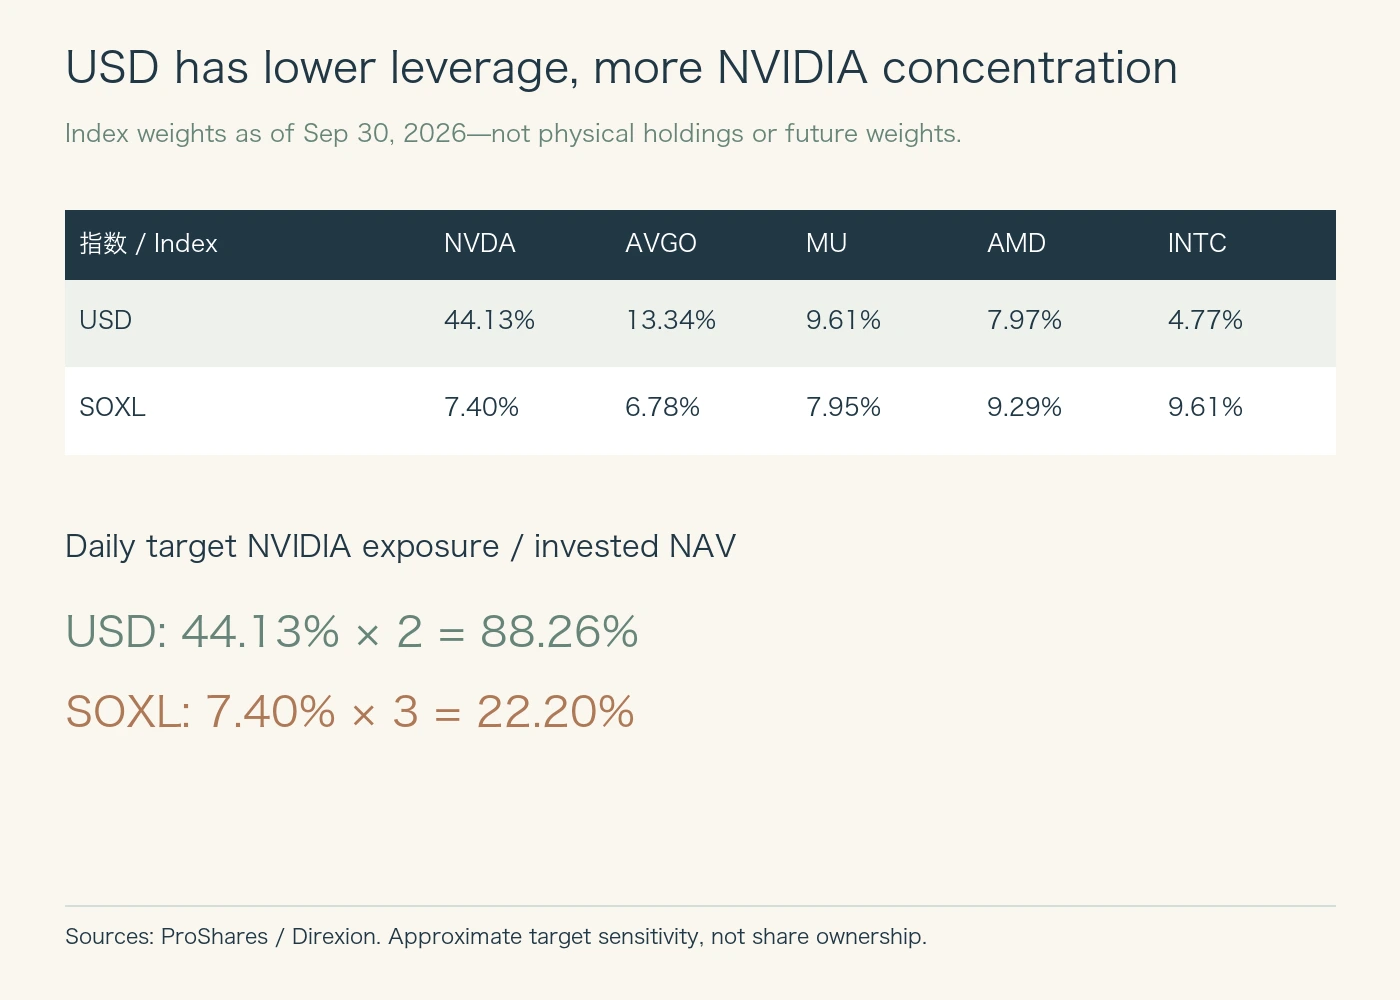
| NVIDIA | 44.13% | 7.40% |
| Broadcom | 13.34% | 6.78% |
| Micron | 9.61% | 7.95% |
| AMD | 7.97% | 9.29% |
| Intel | 4.77% | 9.61% |
These are weights in each index, not weights normalized across the five displayed companies. A stock absent from a top-holdings table has not been assumed to have a zero weight. NVIDIA’s 44.13% weight in USD’s benchmark, versus 7.40% in SOXL’s, creates a substantial difference before the leverage multiplier enters the calculation.
What does an equal $10,000 investment expose you to?
For a short-horizon target-sensitivity approximation, multiply index weight by daily leverage. USD gives 44.13% × 2 = 88.26%; SOXL gives 7.40% × 3 = 22.20%. Applied to $10,000, the corresponding NVIDIA target notionals are approximately $8,826 and $2,220.
This does not mean you own that dollar amount of NVIDIA shares directly. It allocates the index exposure sought through the fund’s holdings and derivatives to one constituent. Actual sensitivity changes with prices, rebalancing and tracking. Today’s calculation should not be reused indefinitely as a fixed future weight.
A physical-stock holdings table can show a different percentage without contradicting the benchmark. Derivatives provide additional exposure, and collateral cash is not simply uninvested risk-free money. Multiplying the index by the fund target and then adding physical shares again would double count exposure.
Advertisement
Three one-day scenarios show why the multiplier is not enough
Freeze the September 30 weights and exclude costs, FX and tracking error. If NVIDIA falls 10% and every other constituent is flat, USD’s idealized daily return is approximately −8.83%, versus SOXL’s −2.22%. In this specific shock, the 2x fund falls more.
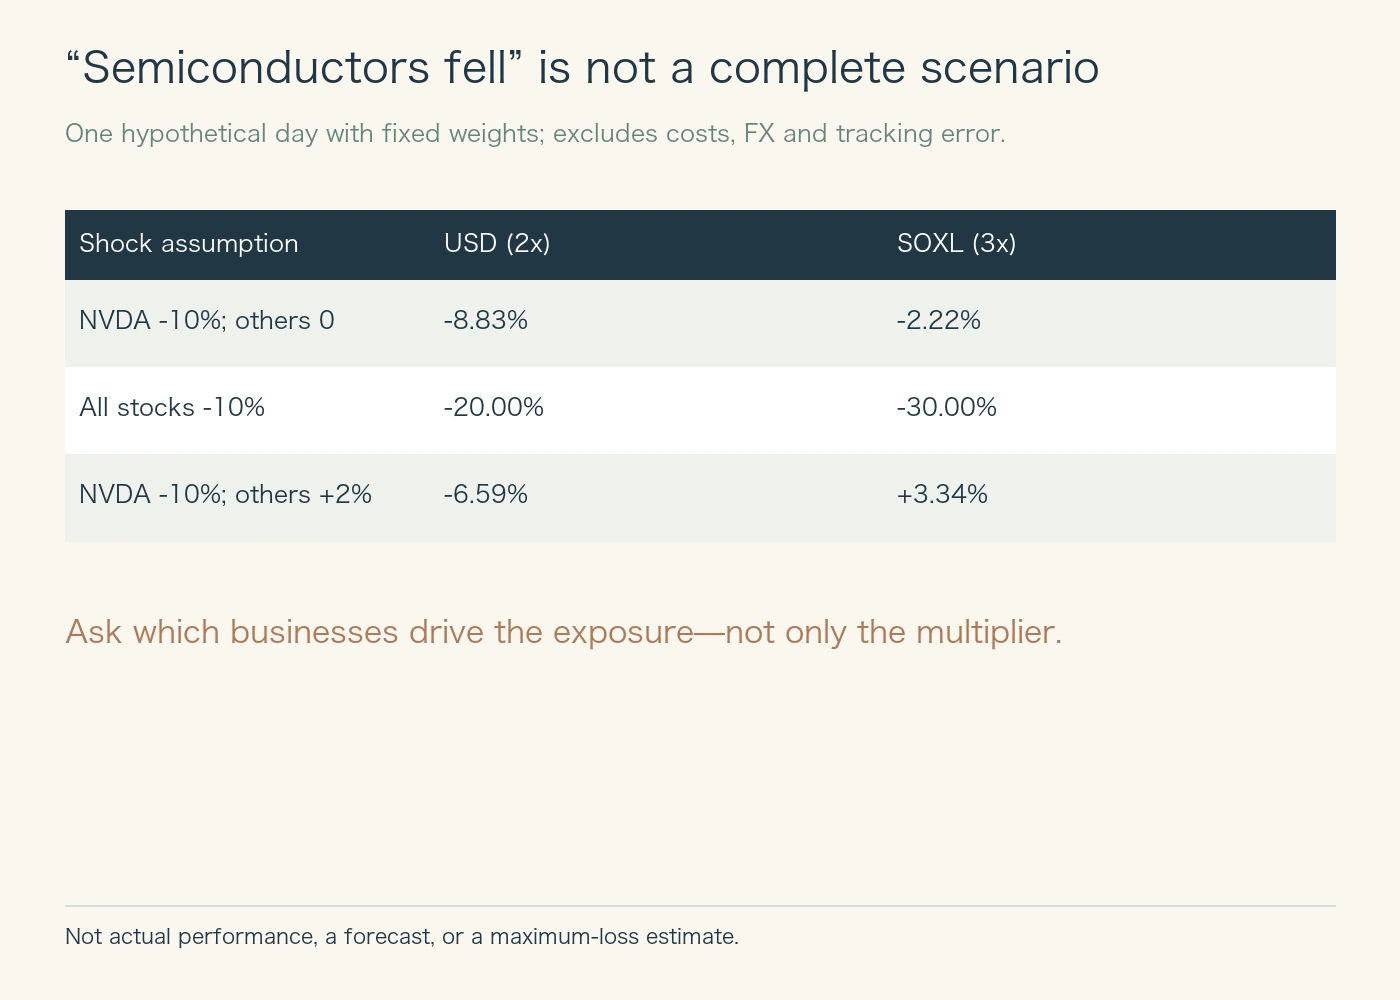
If every constituent falls 10%, the idealized returns become −20% for USD and −30% for SOXL. Here, the multiplier dominates. If NVIDIA falls 10% while every other constituent rises 2%, the model gives about −6.59% for USD and +3.34% for SOXL. The signs can differ.
These are deliberately simplified scenarios, not predictions. Their purpose is to expose a dependency hidden by the phrase “semiconductor stocks fell.” Which businesses move matters. Three scenarios cannot establish an expected return or a universal safety ranking for either product.
Keep index weight, leverage and portfolio allocation in separate layers
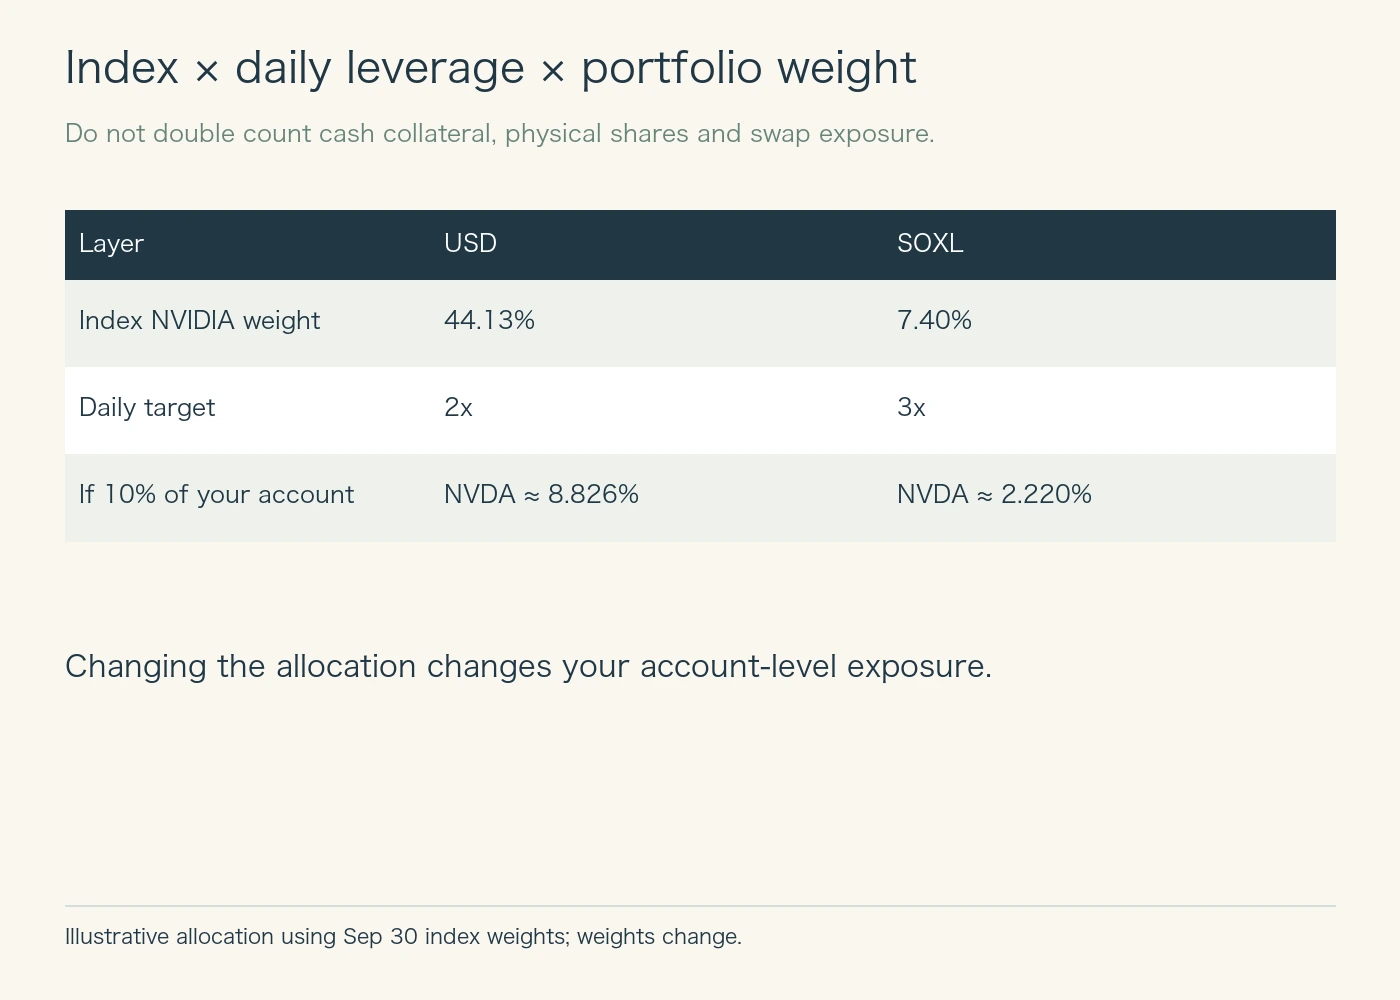
At a hypothetical 10% account allocation, the same NVIDIA sensitivity becomes approximately 8.826% of the account through USD and 2.220% through SOXL. Yet target exposure to each full sector index is 20% and 30% respectively. Single-company concentration and broad sector leverage measure different risks.
Existing NVIDIA shares and Nasdaq-100 funds add overlapping exposure. More ticker symbols do not necessarily diversify the underlying businesses. Before choosing the fund, identify whether your account is most vulnerable to a sector-wide downturn, a particular company’s disappointment, or both.
Check costs and execution after understanding the exposure
Review the latest gross and net expense ratios and any waiver conditions in issuer documents. A published ratio is not every economic cost of leveraged exposure: financing, derivatives, daily compounding and trading frictions can affect returns. Do not treat a temporarily reduced net ratio as permanent.
For liquidity, inspect the spread, displayed size and premium or discount relevant to your order and trading time. One day’s volume is not a complete measure of execution quality. Limit orders control the acceptable price but may not fill. Investors spending in another currency also face exchange-rate risk; dollar performance and home-currency outcomes are different measurements.
Related book (affiliate advertisement)
Related background on the semiconductor industry and its geopolitical dependencies; not a forecast of either leveraged ETF.
Chip War: The Fight for the World’s Most Critical Technology (English hardcover)
View this edition on Amazon Japan
Check the linked page for price and availability. As an Amazon Associate, Y-bow earns from qualifying purchases.
Advertisement
An investor checklist for SOXL versus USD
← Swipe to view the full table →
| Question | Evidence to inspect |
|---|---|
| What do I want to own? | Benchmark methodology and same-date weights |
| What does leverage mean here? | Daily objective versus multi-day results |
| Where is the concentration? | Company weight × leverage × account allocation |
| How will I trade? | Actual spread, order size and execution conditions |
| What loss can I withstand? | Company-specific and sector-wide shocks, spending needs |
If your reason to switch is simply “SOXL is too volatile,” check whether the alternative increases the particular company exposure you wanted to reduce. Unleveraged funds or a smaller position can also be relevant alternatives. The useful starting point is the desired business exposure and loss capacity, rather than a forced choice between two geared products.
Related explanations, primary sources and update policy
The SOXL, SOXX and SMH comparison covers unleveraged alternatives and index composition. Our English full-length SOXL/TQQQ video explains why index recovery does not guarantee recovery in a daily geared fund. The free Japanese note with four calculations is supplementary background.
The two issuer product pages cited above are the original sources for the September 30, 2026 index snapshots. Each hypothetical daily index return equals the sum of constituent weights multiplied by assumed stock returns; we then multiply by the daily fund target. “Other stocks” means the remaining weight of each complete index, not an identical set of names.
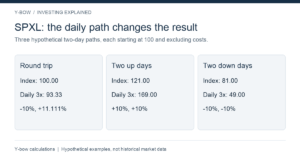
Future updates will align both benchmarks to a new common date and distinguish index-rule changes from market-driven weight changes. The three figures are Y-bow originals; the header is AI-generated conceptual artwork.


Comments