

You sell a stock, and it immediately rallies. A company you never owned doubles while your feed insists that the shorts still have to cover. Suddenly the question is no longer what the business is worth. It is whether you can afford to miss the next move.
A short seller being in trouble does not make your entry price safe. A squeeze can produce spectacular moves, but buying after one has started leaves you dependent on what happens next. Someone else’s bad position is not a promise of your profit.
Sources and market-data definitions checked October 23, 2026. Examples are hypothetical, not forecasts or personalized investment advice. This is an educational stock-market guide, not a list of squeeze candidates.
What is a short squeeze, and why do shorts buy back shares?
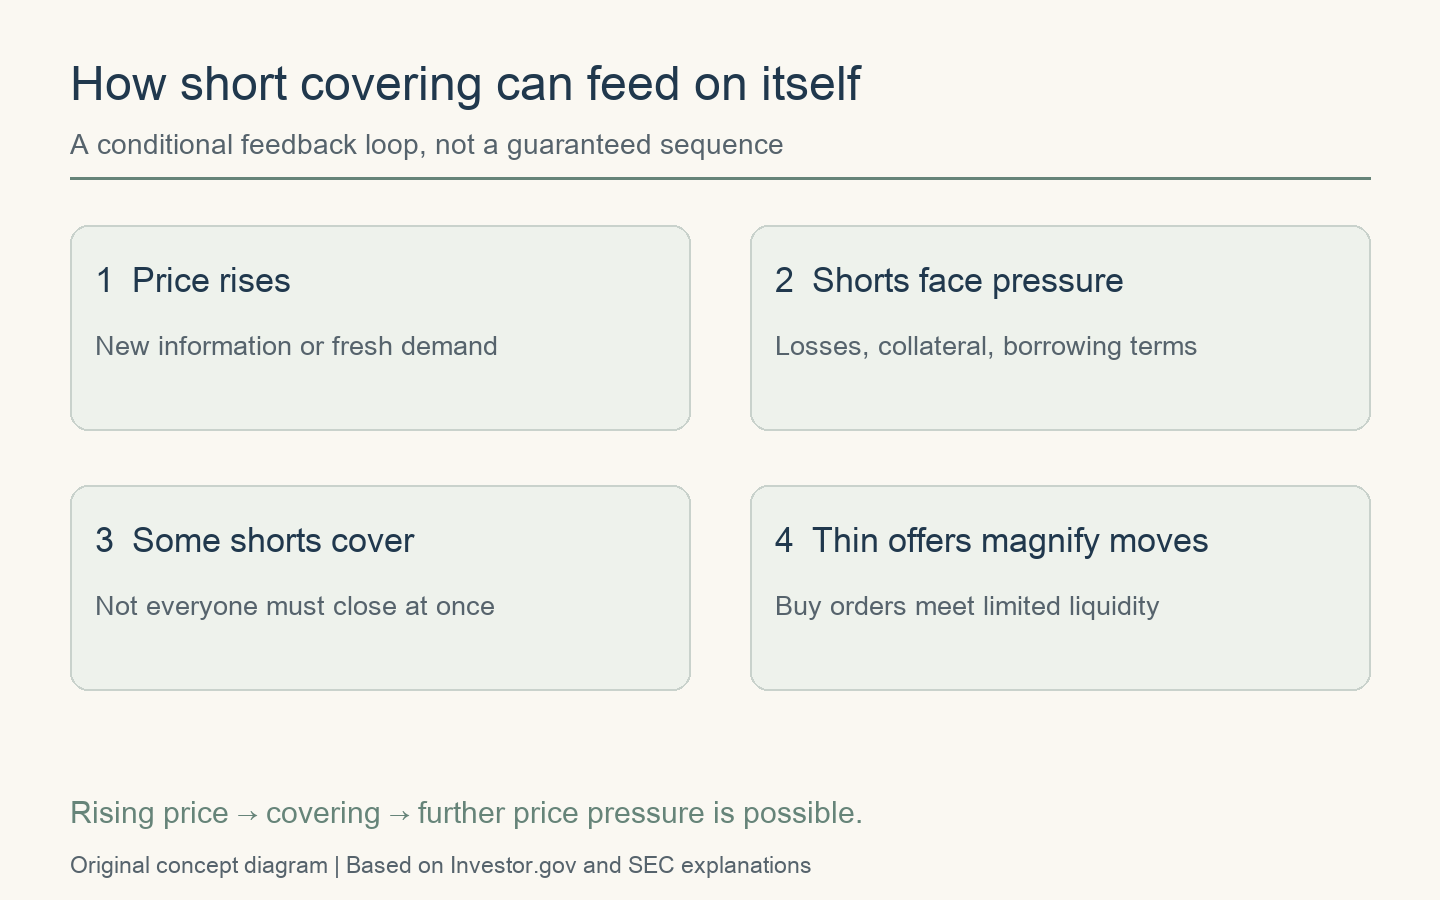
A short squeeze occurs when short sellers come under pressure to close positions, and their purchases help push the price higher. That price increase can put other shorts under pressure. Ordinary short covering does not necessarily become a squeeze: the feedback depends on available liquidity, the size of positions and the urgency of the buyers.
A $50 short sale can lose more than its original proceeds
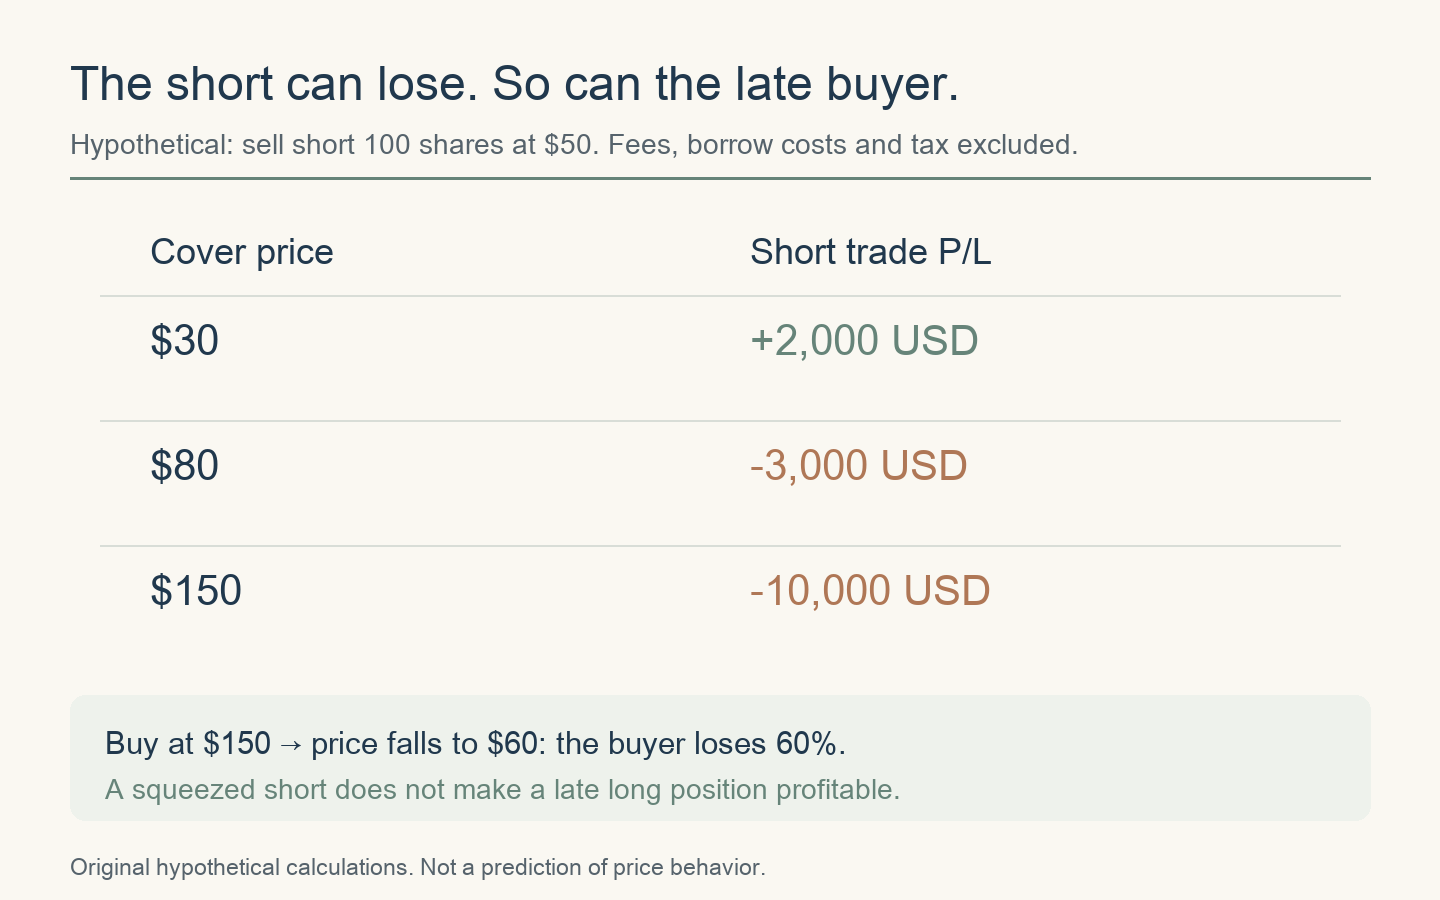
Suppose you borrow and sell 100 shares at $50, receiving $5,000 in sale proceeds. Cover at $30 and the trading profit is $2,000. Cover at $80 and the loss is $3,000. Cover at $150 and the loss is $10,000. These figures exclude fees, borrowing expenses and tax. Sale proceeds are not free profit; the position carries collateral requirements and an obligation to return shares.
The maximum price decline is to zero, but a rising share price has no equivalent theoretical ceiling. Borrow costs, collateral demands and the terms of the loan can matter before your view on the company is resolved. See the SEC’s Investor.gov introduction to short sales.
Why high short interest does not guarantee a squeeze
A large short position is potential demand for shares, not an appointment to purchase them tomorrow. A well-funded investor may maintain the trade. A position might hedge another investment rather than express an isolated bearish view. New sellers may outweigh covering if the company’s outlook deteriorates.
I would separate two questions: how much could be bought back, and what would make those investors hurry? A crowded trade without a catalyst can stay crowded. A smaller position facing thin sell orders can still move the market sharply.
Short interest vs short-sale volume: a position is not a flow
Short interest measures open positions at a reporting date. FINRA collects reports twice monthly. Daily short-sale volume measures qualifying transactions, including sales that may be closed the same day. Adding daily short volume does not reconstruct the open short position. FINRA’s daily off-exchange files also have a particular coverage scope. Source: FINRA’s explanation.
| Measure | What it measures | What to check |
|---|---|---|
| Short interest | Open shares short at a reporting date | Check the position date; not daily transaction volume |
| Short interest / float | Shares short ÷ float × 100 | Float estimate, date and definition; not shares outstanding |
| Daily short-sale volume | Short transactions within a defined scope | Not the position remaining open tomorrow |
| Days to cover | Shares short ÷ average daily volume | Check the averaging window and markets; not a deadline |
| Borrow fee | Cost and terms of borrowing stock | Annualization, valuation basis and recall terms vary |
Before comparing two websites, check the denominator. Short interest as a percentage of shares outstanding differs from short interest as a percentage of float. Providers can also estimate float differently or update it on different dates. Float is not the number of shares actually offered for sale today; nor does it perfectly describe every share available to borrow.
A ratio can rise even when nobody adds a new short
In a fictional company, 2 million shares short divided by a 10 million share float is 20%. Divide the same short position by an 8 million share float and the display becomes 25%. No additional short sale is needed for that change.
This is why I would compare both the share count and the denominator before calling a jump in the percentage a change in investor conviction. Repurchases, major-holder transactions and stock splits can affect the comparison. Our buybacks and dilution guide explains why share counts deserve a separate reconciliation.
広告
Days to cover: calculation, examples and the denominator trap
Days to cover = shares sold short ÷ average daily share volume. It expresses short interest in units of average trading days. Verify the averaging window and market coverage used by your provider. FINRA Notice 21-19, footnote 5, supplies the definition; this guide does not treat the notice’s 2021 proposals as current enacted rules.
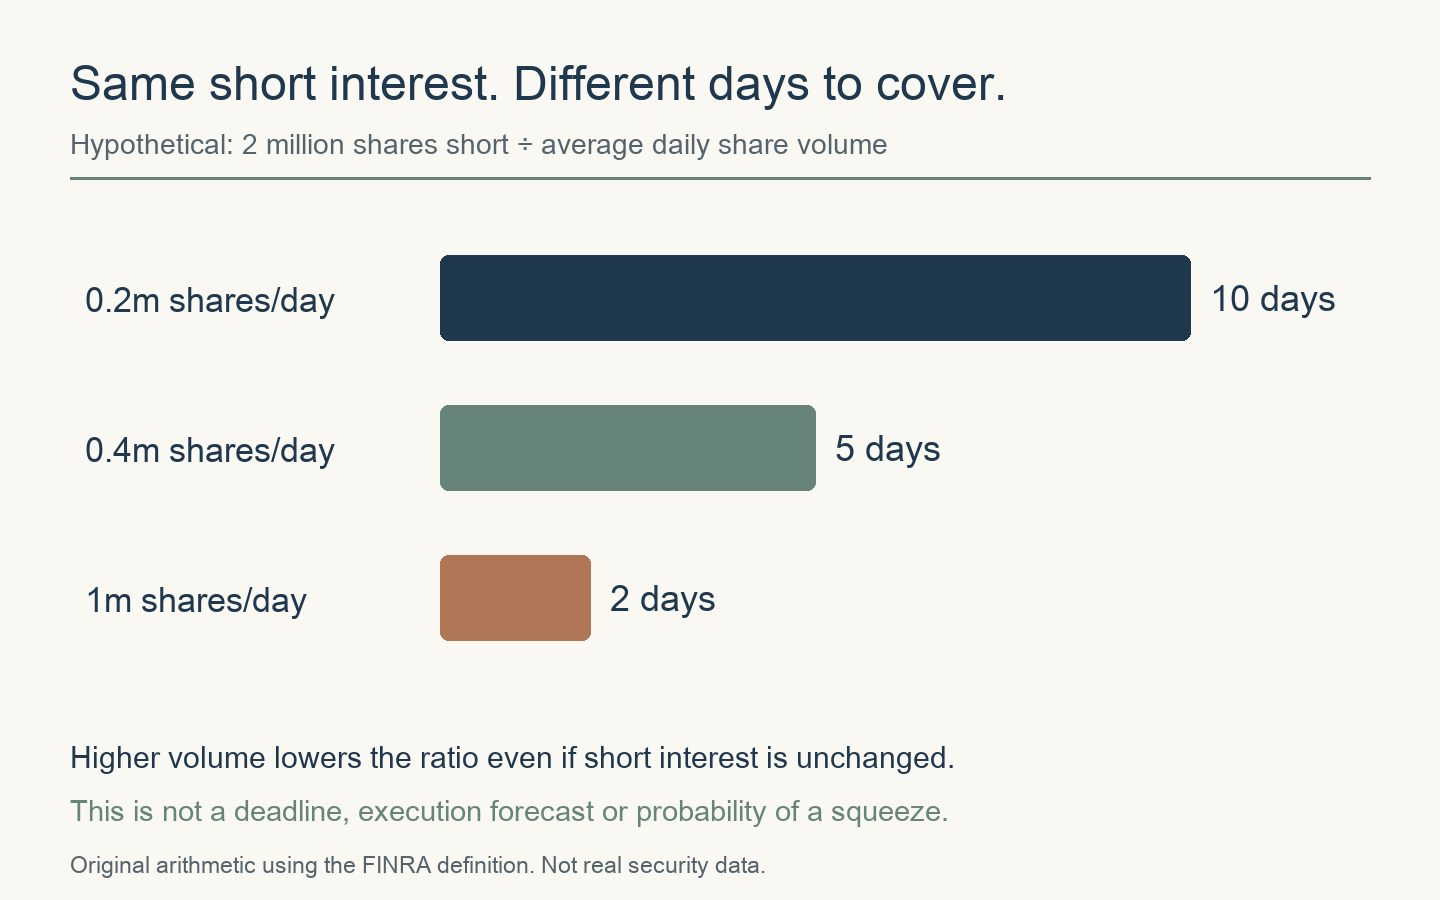
Hold the hypothetical position at 2 million shares. Average daily volume of 200,000 gives 10 days; 400,000 gives five; 1 million gives two. The indicator falls when volume increases even if the short position has not changed.
Ten days to cover is not a deadline—or ten more days of gains
The denominator is total measured trading volume, not volume reserved for covering. The same shares can change hands repeatedly. Shorts need not close together, and future liquidity can differ drastically from its historical average. The ratio does not establish how many shares could be bought at a specified price.
Record the short-interest settlement date, publication date and volume window next to the number. Mixing an older position with the volume generated by a new rally can produce a neat calculation that tells you much less about today’s crowding than you expect.
Japan’s margin balances are not a substitute for U.S. short interest
For readers following Japanese companies, a low margin-buy-to-margin-sell ratio is a different statistic from short interest divided by float. JPX margin data, securities-finance loan balances and disclosed large short positions cover different populations. Avoid combining them into one supposedly complete count.
JPX’s public short-position page covers reported positions at or above 0.5%. Absence from that list does not establish a zero short position, and calculation dates differ from publication dates. See JPX’s disclosure page and reporting guide.
Japan’s standardized margin system also allows delivery of shares already obtained elsewhere to settle a short, rather than requiring an identical purchase on the exchange at that moment. Its stock-shortage fees and general-credit borrowing arrangements should not be conflated. Source: JPX’s margin-trading mechanics. A falling reported balance is not automatically a matching quantity of new exchange buy orders.
GameStop and Volkswagen: what the primary records actually say
GameStop: covering contributed, but did not explain the whole rally
The SEC staff’s 2021 report recorded GameStop short interest at 122.97% of float. Covering contributed during some intervals, but staff did not attribute the sustained weeks-long appreciation to covering alone. Staff also found no evidence of a gamma squeeze in that January episode. These are staff findings, not a Commission adjudication. Report, printed pages 21 and 25–29.
“Contributed” and “explained everything” are different claims. The useful lesson is to resist assigning an entire rally to the most memorable mechanism. It is not that covering never occurred, or that every other crowded stock will follow the same path.
Volkswagen: ownership and option exposure were different things
On October 26, 2008, Porsche SE disclosed 42.6% of Volkswagen ordinary shares plus cash-settled options relating to another 31.5%. A later release described short covering and proposed settling hedges representing up to 5% of ordinary shares. Initial disclosure; subsequent release.
The option exposure was not the same as owning those shares outright. The releases also express an interested participant’s account, not an independent causal audit. For another company, examine contracts and potential share availability instead of mechanically copying Volkswagen’s percentages into a forecast.
Short squeeze vs gamma squeeze: different sources of buying
Short covering closes a stock short. A gamma squeeze involves options-related hedging: for example, a participant short calls may need to buy more underlying shares as the price changes. The required hedge depends on the participant’s overall exposures, other positions and the option terms.
High call volume or large open interest alone does not reveal the dealers’ net position, the direction of every customer trade or the hedge that will be needed next. The label “gamma squeeze” should describe a supported mechanism, not replace missing position data.
広告
Three risks before chasing a squeeze
1. Both the original short and the late buyer can lose
Imagine a stock rising from $50 to $150 before retreating to $60. An investor short from $50 still loses if they cover at $60. A new buyer at $150 loses 60%. Different entry points allow both participants to have a bad result. There is no rule transferring a short seller’s loss into your future return.
2. An expensive borrow is not a covering timetable
Assume a constant $10,000 borrowing value, a constant 30% annual fee and a 365-day convention. Seven days cost approximately $57.53: $10,000 × 0.30 × 7 ÷ 365. This is illustrative arithmetic, not a real broker quote. Actual terms, day-count conventions, valuation bases and rates vary.
Higher expenses can increase pressure, but they do not tell you each investor’s capital, entry price or hedge. A recall or change in share availability is a separate issue from the annualized rate displayed on a screen.
3. Your planned exit price may not be available
A stop that becomes a market order can execute away from its trigger during a gap or a fast market. A limit order adds a price condition but may not fill. A price shown in a recent trade is not a promise that your whole position can exit there.
Source on order behavior: Investor.gov on stop and stop-limit orders
Before discussing upside, calculate the cash loss at a worse price and ask whether a failed exit or an overnight position would be manageable. If the trade is really an attempt to recover earlier losses, read our guide to chasing losses and the break-even trap.
A short-squeeze checklist that keeps valuation in the picture
| Item | Check | Avoid this assumption |
|---|---|---|
| Data | Series name, position date, publication date, denominator | Calling an old snapshot live positioning |
| Catalyst | New earnings, contracts or borrowing changes | Assuming a large short must rush to cover |
| Liquidity | Current offers and spreads, not only average volume | Expecting your whole trade to fill at the last price |
| Share supply | Issuance, conversions, repurchases and major holders | Assuming float is fixed |
| Business and price | Cash needs, earnings and expectations in the price | Using crowding as a complete valuation |
| Failure case | Worse execution, overnight risk and cash needs | Treating a planned stop as a maximum loss |
Would you still have a reason to own the business if no short covering followed? Check earnings, cash needs, possible issuance and competition. If “the shorts must buy” is the only explanation for holding, you have no valuation argument left when that demand weakens.
A repurchase authorization is not an executed purchase. New shares or convertible securities can change potential supply. And as the good-earnings, falling-stock guide explains, a favorable business development and an attractive price are separate judgments.
Short-squeeze FAQ
What percentage of short interest is high enough to buy?
There is no universal entry threshold. The denominator, age of the data, liquidity, borrowing conditions and business news change the meaning. The 20% and 25% figures above are assumptions, not trading signals.
Does short interest above 100% prove illegal short selling?
No. The SEC report describes how shares purchased from a short seller can subsequently be lent again, allowing reported short interest to exceed 100%. A ratio alone does not establish illegal conduct.
Does a rising price and falling short interest prove a squeeze?
It is consistent with covering but does not establish the cause of the whole move. Other buyers can enter during the same reporting interval. Match the dates before drawing even that limited inference.
Must the price fall after shorts cover?
No. New demand or improved business prospects can support it. But a thesis based only on forced buying has little to say about value once that buying subsides.
Sources, original calculations and update policy
The linked Investor.gov, FINRA and JPX materials supply definitions and market mechanics. The SEC staff report and Porsche SE releases supply historical evidence, with the limitations stated above. No source charts are reproduced. Diagrams and worked examples are original. Short P/L = (sale price − cover price) × shares; days to cover = short position ÷ average daily share volume; a buyer’s price return = exit price ÷ entry price − 1. Costs, currency effects and tax are excluded except where specified.
No current squeeze ranking, price target or profit promise is presented. Relevant definitions will be updated if reporting practices change. For the emotional side of volatile markets, see our market-downturn checklist.







Comments