

A new leveraged ETF launches, the market falls, and a convincing story appears: fund companies bring out exciting products just before a crash. The chronology may be real. The forecasting rule is much harder to establish.
I understand the appeal of the argument. Launches attract attention, and a painful decline makes the date memorable. But before turning a product announcement into a sell signal, we need to specify the claim and count the cases that did not work.
What would it mean for an ETF launch to predict a crash?
A testable version needs at least four definitions: which products, which market, how large a decline and how long after launch. “A leveraged ETF launches and eventually stocks fall” is not precise enough. Almost any market will experience a decline if you wait long enough.
A 20% fall from the launch-day level differs from a 20% drawdown from a later peak. An ETF's own 20% loss is another event again, especially with daily leverage. Choose the measure before looking at the result.
| Definition to fix | Example of a test specification | Why it matters |
|---|---|---|
| Product sample | All qualifying daily leveraged equity fund launches in a defined period | Excludes choosing only memorable launches |
| Outcome | Benchmark declines 20% from launch-day close | Avoids switching between index and fund losses |
| Window | Next 252 trading days | Prevents extending the deadline after a miss |
| Comparison | Matched non-launch dates | Tests whether launch dates add information |
These are example research choices, not a completed empirical study. Other definitions can be valid, but changing them after seeing the answer changes what the test means.
Launch dates provide chronology, not a causal mechanism
Three issuer records illustrate why the market backdrop must be examined separately. SPXL launched on November 5, 2008, during the financial crisis. TQQQ launched on February 9, 2010. INDL dates from March 11, 2010.
Putting all three under “new leveraged funds appear at the top” overlooks the fact that the first appeared during an already severe crisis. The two 2010 launches also concern different benchmarks. A general U.S. equity crash and an India-equity result cannot be switched freely to make a prediction count as correct.
The launch date alone tells us when the fund started. It does not establish why a later market movement happened. You would need evidence of a mechanism linking a particular fund's flows or trading to market prices before claiming causation.
Why a long event window can make an ordinary date look prophetic
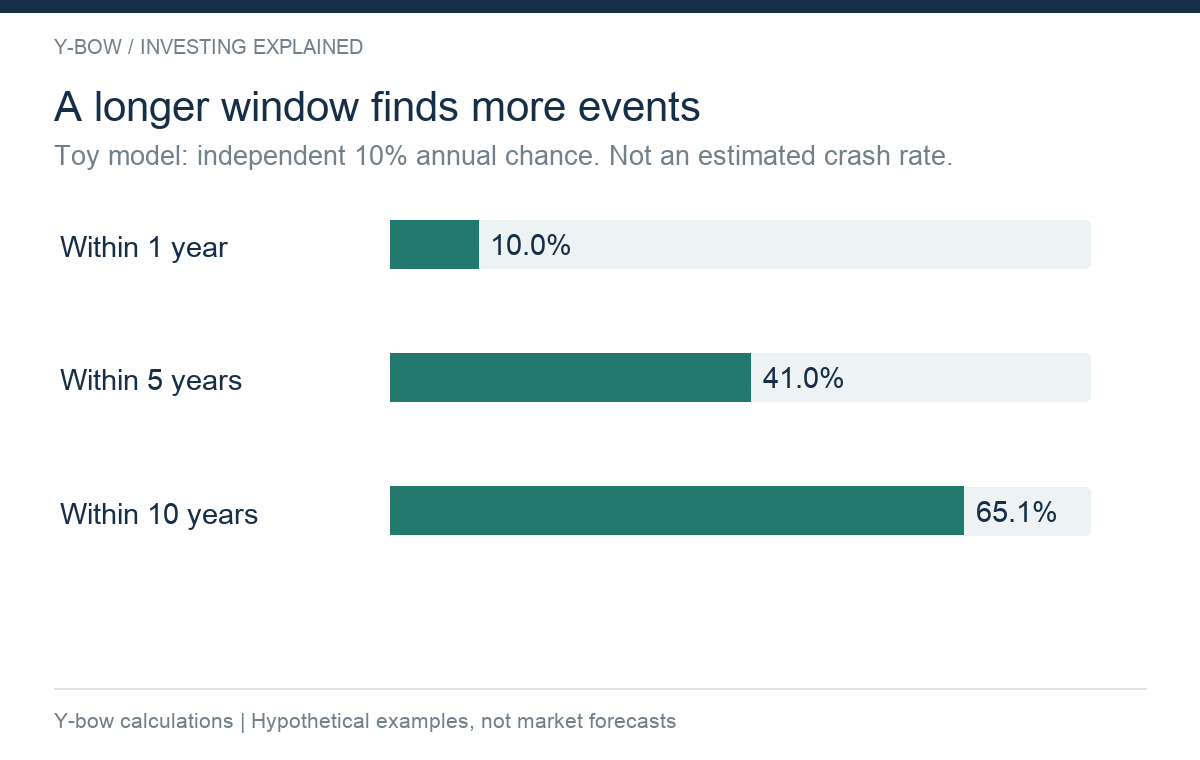
Here is an invented probability example, not an estimate of actual crash frequencies. Suppose each year has an independent 10% chance of a specified event. The chance of at least one event within one year is 10%; within five years it is 1 − 0.9^5, or about 41%; within ten years it is about 65%.
The underlying annual risk did not change. Only the amount of time allowed for the prediction increased. Real financial events are not independent coin tosses, but the illustration shows why “a crash eventually followed” is weak evidence without a fixed deadline.
A similar problem arises if the event threshold is loosened. Calling any 5% correction a crash makes a rule easier to satisfy than requiring a 30% decline. Report the threshold rather than relying on an emotionally strong label.
Count every launch, including liquidated products
A study based only on funds still trading today has survivorship bias. Some launches may have closed, changed objectives or merged. Excluding them can change the apparent success rate.
The sample should include every product meeting the chosen definition, using the objective and benchmark that applied at launch. A current factsheet may describe a later objective. Keep the historical prospectus or issuer notice alongside the date.
Overlapping launches also need care. Ten funds launched around the same market episode do not necessarily supply ten independent observations. Treating them as independent can make a small amount of market history look statistically much stronger than it is.
Compare with ordinary dates, not just other memorable launches
Imagine a hypothetical sample where 12 of 40 launch dates are followed by the defined decline. That 30% figure sounds impressive until a comparable set of ordinary dates produces 28%. The difference is two percentage points, not proof of a useful trading edge.
A better control group should reflect the same market, period and relevant starting conditions. Market valuation, recent volatility and prior returns may already explain the subsequent risk. If launches tend to follow strong markets, the launch could be a symptom of investor demand rather than an additional predictor.
Even a genuine statistical association would not automatically be tradable. Transaction costs, taxes, missed upside and the chosen re-entry rule determine whether acting on the signal improves an investor's result.
Reverse the question: how many crashes had no useful launch signal?
A rule can look accurate among its own chosen examples and still miss most of the events you care about. Count both false alarms and missed crashes. Specify how much warning time the signal provides and whether the signal would have been identifiable using information available then.
Separate the fund announcement, registration, first trade and benchmark-change dates. Selecting whichever date sits closest to a later peak introduces another opportunity to fit the past.
For a reproducible study, publish the full event list, outcome series, date rules and exclusions. Include a spreadsheet or code capable of reproducing the results, not just a chart with two vertical lines. This article does not claim that such a complete historical test has been performed here.
What investors can do with a new-product announcement
Treat it as a reason to read the objective, exposure, costs and liquidity provisions. For a leveraged fund, work through the daily-reset calculation before reacting to the marketing narrative. A newly available product is not a reason your portfolio needs it.
For risk management, a plan based on spending needs and loss capacity remains usable even when a launch-date story fails. If you plan to reduce exposure, explain the allocation you want and what would change your view. “A new fund appeared” does not tell you how large the position should be or when to restore it.
The useful conclusion is narrower than a market-timing slogan: an interesting sequence of dates is the beginning of a question, not the answer to it. Sources checked October 15, 2026. All probability examples and the figure are original hypothetical Y-bow calculations, not empirical market forecasts.










Comments