
Record earnings can be uncomfortable news for a memory investor. The numbers look extraordinary, but the questions remain: Is this a new earnings base, or the top of another NAND cycle? Will AI demand protect profits when supply expands?
Kioxia’s Q2 release on October 30, 2026 offers unusually strong evidence of pricing power and cash generation. Yet its next-quarter revenue and operating-profit guidance barely rises sequentially. Understanding that contrast requires separating prices, shipment volume, contractual visibility and cash commitments, rather than treating a record quarter as a valuation verdict.
Period: FY2026 Q2, July–September 2026, in the fiscal year ending March 2027. These are standalone quarterly figures unless specifically identified otherwise. The Japanese materials call the period “2027年3月期第2四半期.” Research cutoff: October 31, 2026. Company forecasts and Y-bow’s calculations are identified separately. English explanations of Japanese disclosures are our paraphrases.
Kioxia Q2 earnings: distinguish record profits from the growth rate
Swipe horizontally on a phone to read the full table.
| Metric | Q1 actual | Q2 actual | Q3 guidance |
|---|---|---|---|
| Revenue | 1,767.1 | 2,480.0 | 2,500.0 |
| Non-GAAP operating profit | 1,326.2 | 1,988.3 | 2,000.0 |
| IFRS operating profit | 1,270.0 | 1,994.7 | 1,995.0 |
| Non-GAAP operating margin | 75.0% | 80.2% | 80.0% |
| USD/JPY assumption | 160 | 161 | 157 |
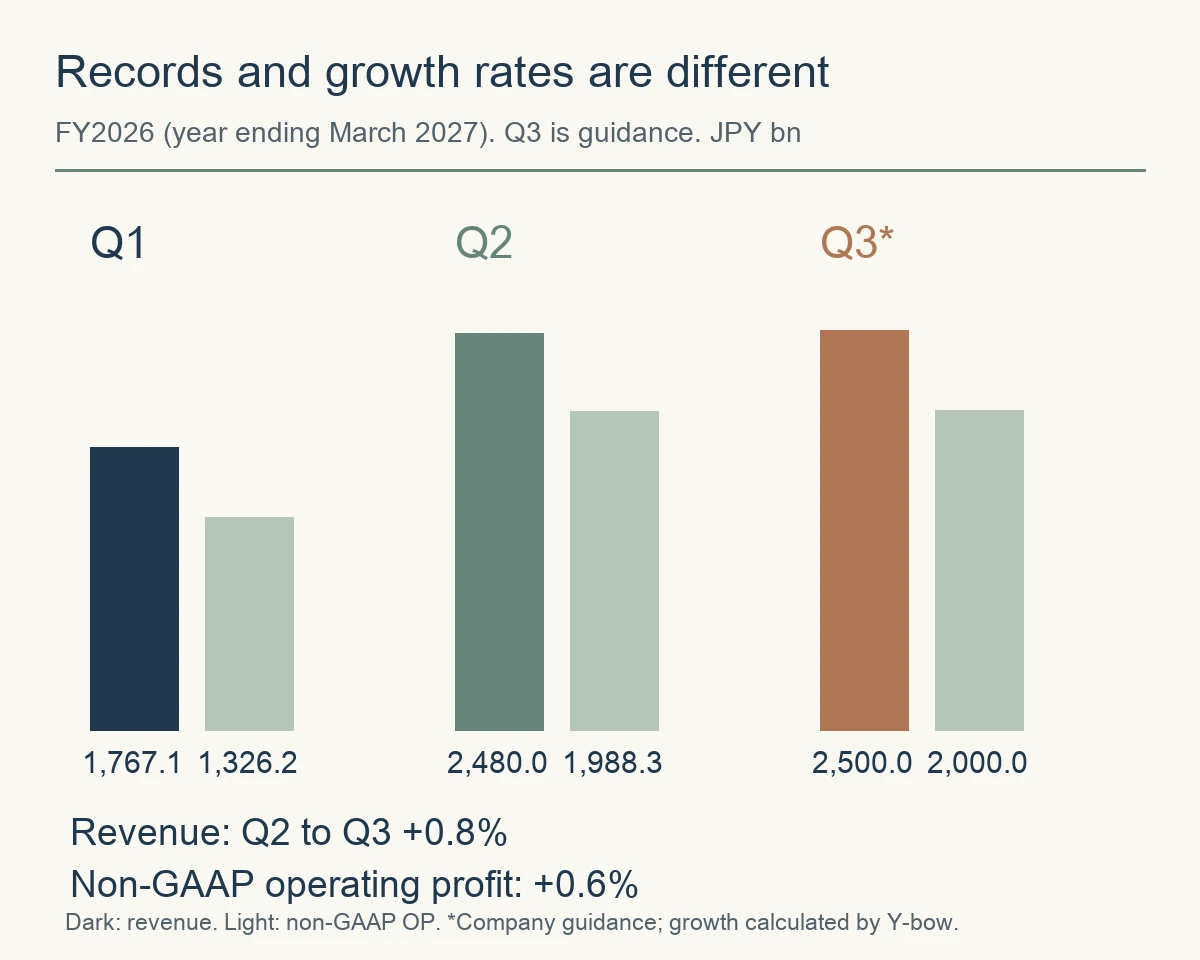
Revenue increased 40.3% from Q1 and non-GAAP operating profit rose 49.9%. Q2 also beat the July 31 guidance: revenue exceeded JPY2,390bn by 3.8%, and non-GAAP operating profit exceeded JPY1,900bn by 4.6%. Q3 guidance, however, implies only 0.8% revenue growth and 0.6% operating-profit growth from Q2. The company rounds both to approximately 1%. Source: quarterly results and Q3 guidance in the presentation
A high profit level and a high growth rate are different things. Guidance can preserve an operating margin near 80% without delivering another large sequential increase. Non-GAAP is also the company’s adjusted measure; it is not interchangeable with IFRS operating profit. Follow a consistent accounting basis across periods.
NAND ASP and shipments: what drove Q2—and what the averages hide
Blended ASP is different from like-for-like pricing
The company describes Q2 US-dollar blended average selling price as increasing by the mid-20s percent sequentially, like-for-like ASP by the low-30s percent, and shipped gigabytes by the low-teens percent. These are ranges, not precise point estimates. Like-for-like pricing adjusts for product mix; blended ASP reflects the average of products actually sold. Neither means every product received an identical price increase. Source: Q2 sales trends
Product mix matters. Enterprise SSDs, PC storage and smartphone memory carry different economics. A slower blended-ASP increase could reflect mix rather than collapsing price negotiations. Conversely, rising blended ASP does not prove every end market is expanding. Multiplying invented midpoints of the disclosed ranges would create a false precision in a price-volume bridge; yen revenue also reflects currency movements.
The useful question for subsequent quarters is therefore two-part: can Kioxia ship more bits while preserving comparable-product prices? Price gains with falling volume, or volume growth purchased through discounts, deserve different interpretations from growth in both.
SSD and storage revenue is not an AI-revenue disclosure
Swipe horizontally on a phone to read the full table.
| Application | Q1 | Q2 | Increase |
|---|---|---|---|
| SSD & storage | 1,174.7 | 1,616.0 | 441.3 |
| Smart devices | 525.7 | 788.9 | 263.2 |
| Other | 66.7 | 75.2 | 8.5 |
SSD and storage contributed about 61.9% of the total sequential revenue increase of JPY712.9bn, calculated from rounded company figures. That is an incremental revenue contribution, not the company’s AI revenue share. SSD and storage includes PC products. Data-center and enterprise customers account for the mid-60s percent of that segment, not of the entire group, and even that demand cannot all be assigned to generative AI. Rounding explains the JPY0.1bn difference between summed application revenue and the group total.
Smart-device revenue also increased substantially. AI storage growth does not remove smartphone demand, PC replacement cycles or customers’ inventory adjustments from the NAND pricing equation. An investor should retain both the new demand story and the older end-market checks.
TLC, QLC and the actual AI-storage use case
In the follow-up Q&A, management associates TLC with KV-cache and high-speed SSD uses, and QLC with high-capacity data lakes, nearline-HDD replacement and warm storage. Its LC9 QLC SSD family, including a 245TB model, has entered mass production while customer qualifications progress. Production, qualification and revenue recognition across customers are separate milestones; the disclosure does not mean every customer has approved the product. Source: Q&A on QLC SSD demand
NAND storage is also different from HBM placed close to GPUs. For investment analysis, ask which workload needs more persistent capacity, bandwidth or lower cost, and when customer qualification enables shipments. See our KV-cache and inference-memory guide and memory-industry company map for the underlying distinctions.
Advertisement
Why Q3 guidance is nearly flat: shipment timing, mix and the yen
Management expects Q3 gigabyte shipments to remain broadly similar to Q2. It says some volume was sold in Q2, while longer-lead-time data-center and enterprise products push some planned Q3 shipments into Q4. Q3 also has a relatively larger smart-device mix and a more modest blended-ASP increase. Source: Q&A on Q3 volume and ASP assumptions
The USD/JPY assumption moves from 161 to 157. The company presentation identifies an approximately JPY55bn negative effect on non-GAAP operating profit from that currency change. This is an estimate under this guidance scenario, not a universal per-yen sensitivity to extrapolate across all future periods.
“Flat guidance means AI demand has failed” is therefore too strong. So is “the volume is only delayed, so recovery is guaranteed.” Q4 becomes a testable checkpoint: do the shifted shipments appear, do lead times stabilize, and do prices hold while customers wait? Management expects a large Q4 shipment increase; investors still need the actual result.
Do long-term agreements change the NAND cycle?
According to the Q&A, CY2027 capacity is largely allocated, and multiyear agreements cover well over 50% of CY2028 gigabyte volume. Management has started discussions about business arrangements extending into CY2029 and CY2030. Discussions are not signed contracts covering all production through 2030. Source: Q&A on long-term agreement discussions
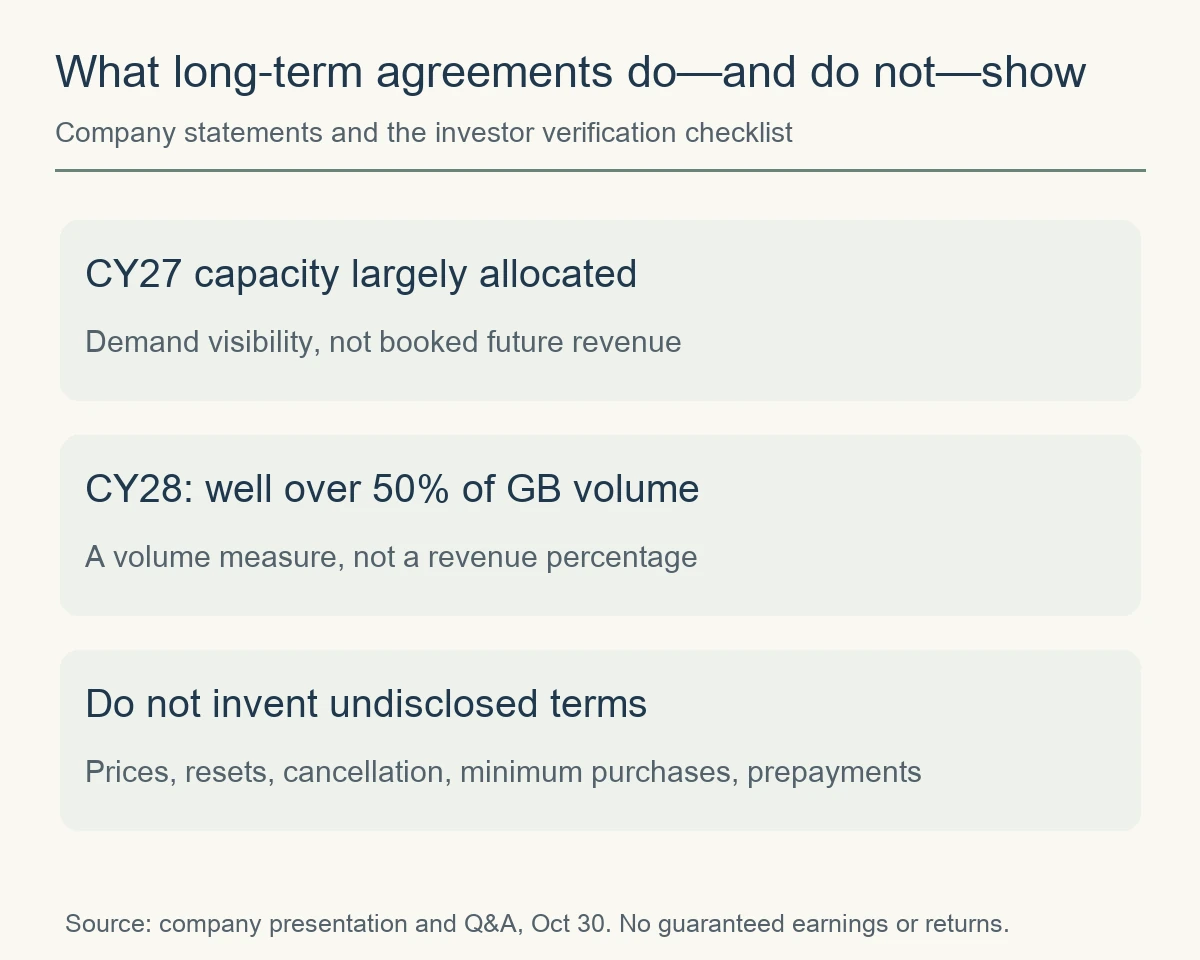
LTAs can improve demand visibility, support investment decisions and strengthen customer relationships. But the reviewed disclosures do not quantify fixed-price duration, reset formulas, minimum purchase obligations, cancellation provisions or prepayments. Those omissions limit what outsiders can infer about downside protection.
A quantity commitment with fully market-linked pricing can still leave a company exposed to a steep profit downturn. Different purchase and pricing terms could create a more durable earnings floor, but that floor cannot be assumed from the volume percentage alone. The defensible conclusion today is stronger volume visibility, not guaranteed future margins.
The company also expects tight supply and an upward ASP trend during CY2027. Its view is valuable first-party evidence, but it is a company forecast, not an independently verified market consensus. Our five-condition framework for a memory supercycle explains why demand growth and resilience during the next downturn require separate tests.
Core free cash flow: strong conversion, with future claims on cash
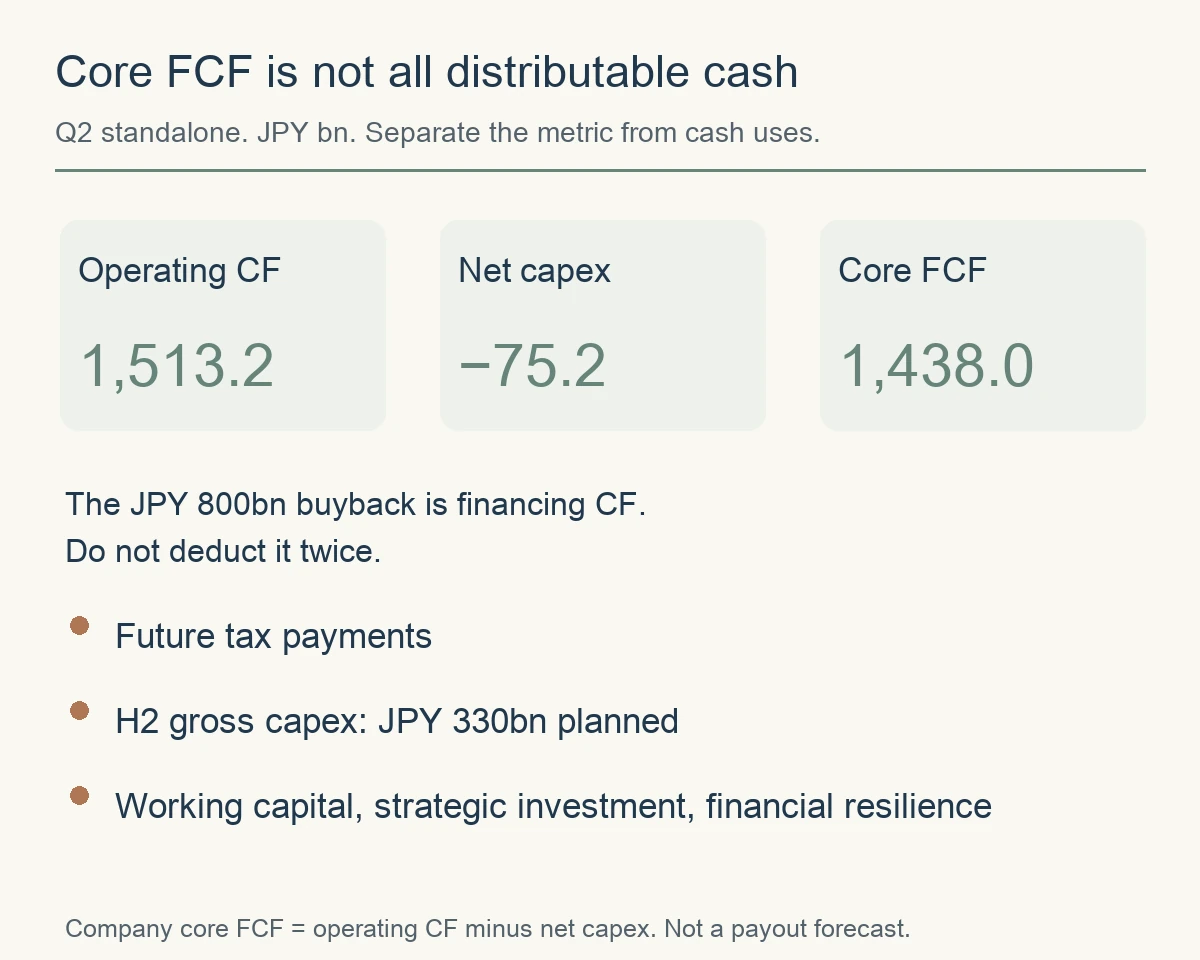
Standalone Q2 operating cash flow was JPY1,513.2bn. Subtracting net capital expenditure of JPY75.2bn produces company-defined core FCF of JPY1,438.0bn. This is meaningful cash conversion, not merely an accounting earnings surge. It is nevertheless a metric before other investing and financing flows, not the amount immediately available for distribution. Source: presentation pages 12–13
Swipe horizontally on a phone to read the full table.
| Item | Change or balance | Interpretation |
|---|---|---|
| Opening cash equivalents | 791.0 | End-June balance |
| Operating cash flow | +1,513.2 | Includes actual tax and working-capital movements |
| Net capex | −75.2 | After capital-expenditure subsidies |
| Other investing cash flow | −0.5 | Outside core FCF |
| Financing cash flow | −827.0 | Includes JPY800bn buyback completed in August |
| Currency effect | −4.2 | Translation effect on cash |
| Closing cash equivalents | 1,397.3 | End-September balance |
Inventory days are not inventory dollars
Inventory increased from JPY438.1bn at end-June to JPY446.0bn at end-September, about 1.8%, even as company-defined inventory days fell from 102 to 94. The days calculation uses a non-GAAP cost basis including R&D. It is not the same as the inventory balance or physical units. An improving ratio should not be rewritten as a decline in the amount of stock.
Trade and other receivables rose about 43.1%, from JPY1,151.6bn to JPY1,648.4bn, alongside 40.3% sequential revenue growth. That comparison alone establishes neither a collection problem nor a clean bill of health. Subsequent collections, operating cash flow and whether receivables continue to outrun sales are the useful follow-up evidence.
Taxes and investment change the cash available after the record quarter
Income taxes payable were JPY974.689bn at end-September, compared with JPY104.516bn at end-March: an increase of about JPY870.2bn over the half year. This is a balance-sheet liability comparison, not Q2 tax paid. The Q&A specifically notes substantial future tax payments. Actual taxes already paid are reflected in operating cash flow; a cash forecast must use payment timing and avoid subtracting the same obligation repeatedly. Source: condensed consolidated statement of financial position
Planned gross capex is JPY330bn in the second half and JPY470bn for the full year. Management says it is bringing forward some next-year spending within the three-year investment budget, without currently planning a major change to that total. Faster near-term spending is therefore different from an unlimited expansion of the medium-term budget. The Kitakami K3 operation plan is FY2029, which should not be confused with immediate shipment capacity.
Company-defined net cash of JPY812.7bn uses foreign-exchange-swap-related treatment and excludes JPY198.8bn of lease liabilities. It consequently should not be forced to equal a simple subtraction of reported bonds and borrowings from cash. Nor does “net cash” mean all future payment obligations have already been deducted.
Related book (affiliate advertisement)
Related reading for understanding why accounting profit, the balance sheet and cash flow can tell different stories. This is an English Kindle ebook, not a print edition.
Financial Intelligence, Revised Edition (English Kindle edition)
View this edition on Amazon Japan
Check the linked page for price and availability. As an Amazon Associate, Y-bow earns from qualifying purchases.
Advertisement
Five investor checks for the next Kioxia earnings release
Swipe horizontally on a phone to read the full table.
| Question | Evidence to look for | Warning to investigate |
|---|---|---|
| Pricing quality | Comparable-product ASP holds | Discounts used to secure volume |
| Shipment timing | Shifted Q4 gigabytes arrive | Further postponement |
| Contract protection | Purchase and pricing terms clarified | Assuming profits from volume alone |
| Cash conversion | Collections and post-tax cash generation | Persistent receivables/inventory growth with weaker cash flow |
| Capital discipline | Returns on investment and resilience | Capacity or cash commitments outrunning demand |
Q2 non-GAAP EPS of JPY833.94 is split-adjusted. Multiplying it by four does not produce a defensible normalized annual EPS. A memory company’s valuation depends on prices across the cycle, investment requirements and share-count changes. This analysis does not use an unverified current stock price, price target or analyst consensus to declare the shares cheap.
For an existing holder, write down what would change the investment thesis: shipment slippage, weaker like-for-like pricing, disappointing cash conversion or improved contractual protection. That creates a framework to update when new evidence arrives. Position size, cash needs and the loss you can tolerate remain separate personal constraints; a strong corporate result does not remove them.
Capital returns and related Japanese-language analysis
The JPY800bn buyback was completed in August; it was not newly announced again with Q2. The interim dividend is JPY90 per pre-split share, equivalent to JPY30 after the October 1 three-for-one split. The final dividend remains undecided. Management’s framework concerns excess cash after growth investment, necessary spending and financial resilience over the medium to long term, not an immediate payout of all quarterly FCF.
For a separate examination of payout limits and tax obligations, see our Kioxia Q2 capital-returns article on note (Japanese; free introduction with partly paid content). The related full-length YouTube explanation of Kioxia Q2, returns and the additional Q&A is also in Japanese. These are supplementary resources; the operating analysis above stands on its cited disclosures.
Primary sources, calculations and update policy
- Q2 financial statements for the year ending March 2027: IFRS results, balance sheet and taxes payable.
- Earnings presentation: quarterly results, application sales, ASP, shipments, cash flow and Q3 guidance.
- Presentation with management script and follow-up Q&A: shipment timing, LTAs, investment and tax-payment context.
- Capital-return and interim-dividend disclosure: conditions and share-split basis.
Sequential growth = (current ÷ previous − 1) × 100. Operating margin uses operating profit and revenue on the same accounting basis. Company core FCF = operating cash flow minus net capex. Calculations use company-rounded figures, so minor rounding differences occur. JPY1bn equals JPY10億. The three data diagrams are Y-bow originals reconstructed from disclosed facts; the header is an AI-generated conceptual illustration.
We will revisit shipment timing, comparable pricing and collections with Q3 results, and subsequent tax and capex cash payments as disclosed. Corrections or additional contractual detail will update the relevant sections. The article is an analytical framework, not a guarantee of earnings or an instruction to trade at a particular price.




Comments