

Owning memory stocks can feel uncomfortable even after an excellent earnings report. AI orders are strong, factories are being expanded, and management sounds confident. Yet one question refuses to go away: is this a more durable business, or another exceptionally profitable point in the cycle?
Selling too early carries a different fear. What if AI really changes the economics, and the old playbook misses that change? The useful response is to identify what would have to change in contracts, supply and cash generation, then test those claims against the next downturn.
This analysis uses company disclosures available on October 18, 2026. Reported results, management expectations and our hypothetical calculations are identified separately. For the company and product landscape, see our memory industry map covering HBM, DRAM and NAND. Here the focus is the conditions that could change the cycle itself.
Can memory stocks escape the four-year cycle? Define the claim first
The familiar four-year memory cycle is a shorthand, not a clock. Customer inventories, device demand, new fabs and manufacturing transitions do not follow a fixed timetable. Two downturns four years apart would not establish a dependable forecasting rule.
Three propositions need separate tests: memory consumption grows over time; producers retain attractive returns through a downturn; and the stocks deliver attractive returns from today’s purchase price. More bits can coexist with lower prices and profits. Better business economics can also be fully reflected in an expensive stock.
For this article, a durable supercycle means a multiyear expansion that raises the floor of earnings and cash left after investment across subsequent adjustments. It does not mean permanently rising prices or the end of stock drawdowns. This is our analytical definition, not a standardized industry classification.
The earlier supercycle narrative: cloud and AI were already part of the story
The old boom was not described solely as a smartphone story. In its FY2017 results released in January 2018, Samsung discussed new data centers, higher server memory content, and opportunities in automotive and AI. Growth applications and supply constraints already appeared together.
Its FY2018 results, released a year later described weaker memory demand and inventory adjustments at data-center customers. Cloud computing had not disappeared. Customers could still pause purchases inside a growing end market.
That comparison does not mean Samsung promised an end to cyclicality or used the word supercycle in those releases. Market commentary and the statements companies actually made should not be attributed interchangeably.
| Question | Earlier evidence | What must be different now |
|---|---|---|
| New applications | Cloud and higher content were already growth drivers | Demonstrated changes in product mix and shipped demand |
| Inventories | Server customers also adjusted inventories | Contract terms that protect volumes and economics |
| Scarcity | Supply constraints were part of the earlier outlook | Tightness after yields, transitions and new capacity improve |
| Resilience | Growth did not prevent earnings declines | A higher profit and cash floor when pricing weakens |
Micron’s history shows the difference between secular growth and earnings stability
Micron’s reported GAAP revenue fell from $30.391 billion in FY2018 to $23.406 billion in FY2019, while operating margin declined from 49.3% to 31.5%. Revenue then fell from $30.758 billion in FY2022 to $15.540 billion in FY2023; operating margin moved from 31.5% to −37.0%. Sources: FY2019 results and FY2023 results.
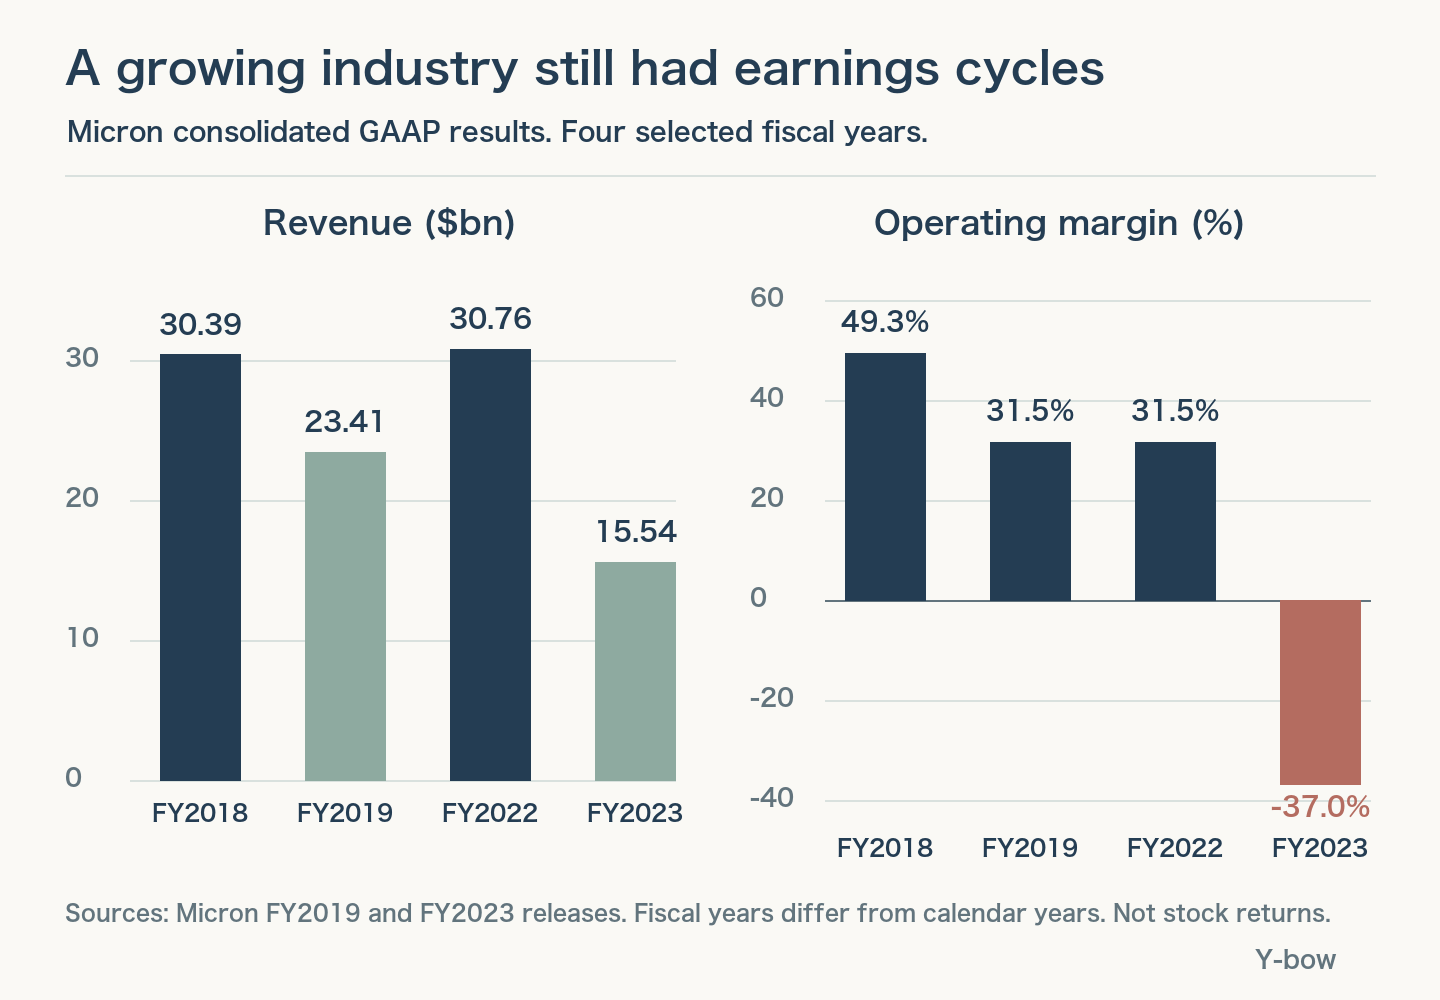
The revenue declines were approximately 23% and 49%, respectively. These are different downturns, not identical repeating waves. The lesson is narrower: a business serving expanding applications can still experience severe earnings swings. The chart does not measure share-price performance or announcement effects.
What is different in 2026? Read the contracts, not just the demand language
Micron SCAs: distinguish committed volume, price protection and revenue coverage
In its September 30 prepared remarks, page 3, Micron reported 26 strategic customer agreements, estimated to account for over 35% of revenue through 2030. About three-quarters of expected SCA revenue has a defined pricing framework; the rest uses periodic market-based negotiations. The coverage is a forward estimate, not a reported current-quarter mix.
Its FY2026 Form 10-K, printed pages 12, 55 and 73–74 describes binding multiyear take-or-pay volumes and pricing arrangements including floors and ceilings. That is more substantive than orders being booked ahead. It still does not guarantee companywide profitability.
The filing also explains that customer deposits can be returned when minimum purchase commitments are met, or retained in whole or part if they are not. Deposits should not be treated as profit already earned. Execution, manufacturing costs and revenue outside the protected arrangements still matter.
SK hynix, Samsung, Sandisk and Kioxia do not have identical exposures
| Company disclosure | Evidence | Limit |
|---|---|---|
| SK hynix 2Q2026 | LTAs with around ten customers; HBM4 volume shipments | This release does not establish every contract’s floor or cancellation terms |
| Samsung 2Q2026 | AI-related HBM, server DRAM and enterprise SSD outlook | Forward demand expectations are not achieved results |
| Sandisk FY2026 Q4 | Data-center revenue of $2.977bn / $8.965bn total: 33.2% | A revenue share is not a bit-volume share |
| Kioxia Investor Day | Targets data-center/enterprise mix above 60% over the medium to long term | A target, not a share already achieved |
A common AI label hides different economic exposures. A NAND-focused producer is not an HBM pure play, and a diversified company’s total earnings are not a clean measure of memory profitability. Nor should one supplier’s disclosed contract protections be assumed to apply to competitors. Where terms are not public, the uncertainty remains.
AI inference expands the opportunity beyond HBM, but not at one uniform rate
HBM sits close to accelerators, but a working service also needs system memory and persistent storage. Models, user context, previously computed information and retrieved documents place different requirements on latency, capacity, power and cost. These requirements create a hierarchy rather than one interchangeable pool of gigabytes.
Kioxia’s Investor Day strategy includes SSDs for inference workloads such as KV-cache handling. A KV cache stores information that helps avoid repeating parts of earlier computation. Moving appropriate data to another tier can make a system more economical; it does not make an SSD equivalent to HBM in performance.
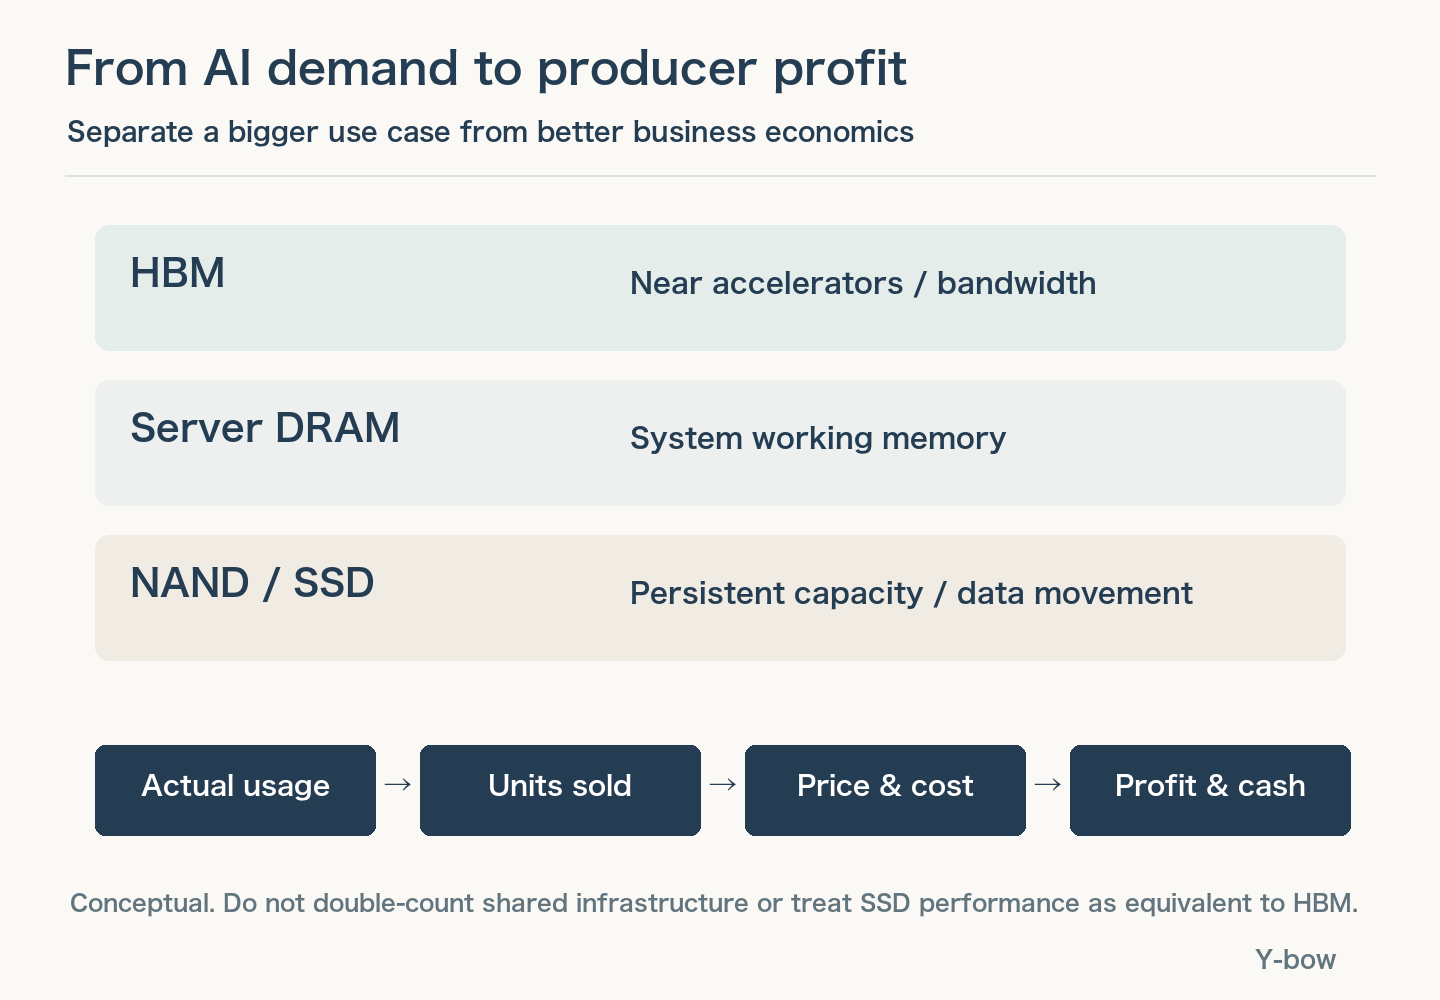
There are two opposing forces to watch. More users, longer contexts and more concurrent work can increase memory demand. Better algorithms and tiering can reduce the amount of expensive memory needed for a given task. Efficiency may encourage enough additional usage to offset that saving, but the size of that response must be observed, not assumed.
Application diversity also does not automatically mean independent spending cycles. Training clusters, inference services and robotics development may draw on the same infrastructure budgets. Adding their headline markets without removing shared infrastructure can double-count demand. Follow deployed systems and the ultimate payer, not just the number of fashionable labels.
Autonomous driving, physical AI and space: turn the story into units and capacity
Content per vehicle is only half the demand equation
Micron’s latest remarks describe memory content above 200GB in Level 4-plus autonomous vehicles and identify physical AI as a future opportunity. This is the company’s description of those systems, not the average content of the current vehicle fleet or proof of a robot production forecast.
The Micron–Ford strategic agreement is a concrete example of automotive customers securing long-term supply. A commercial commitment is useful evidence of customer planning. It does not settle how quickly autonomous vehicles or robots will be deployed globally.
A simple starting equation is annual newly equipped units multiplied by memory per unit. At an illustrative 100GB each, one million new units represent 0.1EB, ten million represent 1EB, and one hundred million represent 10EB. We use decimal units: 1EB equals one billion GB. The 100GB assumption and deployment counts are not forecasts.
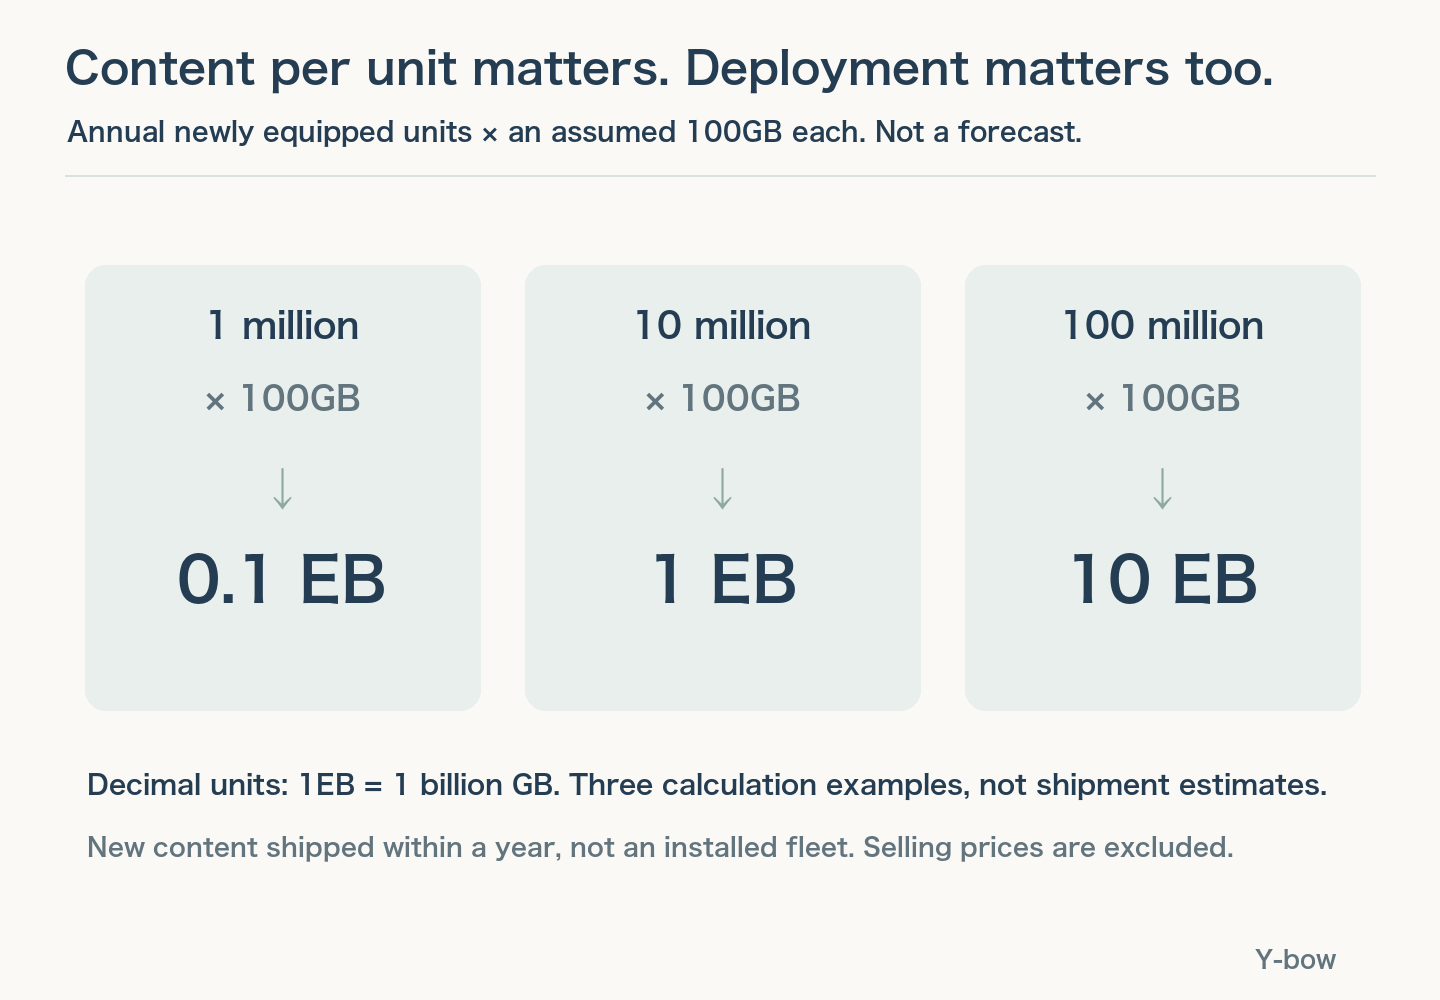
Doubling content per unit cannot compensate for deployment being ten times smaller than expected. Even growing capacity does not translate one-for-one into revenue if dollars per gigabyte fall. For an investable demand thesis, identify the units, timing, bill of materials and selling economics rather than multiplying the most optimistic numbers together.
Space has real deployments; that is not evidence of a cycle-changing market size
Kioxia’s January 2024 announcement describes more than 130TB of SSDs supplied for HPE’s Spaceborne Computer-2 on the International Space Station. That demonstrates an actual use case. It is not a measure of the entire space-memory market.
Power, communications, radiation exposure and delivery costs constrain different space applications. To put orbital computing into a near-term earnings model, investors need credible deployment schedules and memory procurement volumes. The reviewed disclosures do not establish space demand on a scale that independently supports global DRAM or NAND pricing. For now, it belongs in future optionality, rather than the base case for next year’s profits.
Supply constraints can lengthen the upcycle without abolishing it
HBM is DRAM, but shipping a qualified stack requires more than an available conventional DRAM line. Stacking, connections, packaging and customer qualification can constrain usable output. If those bottlenecks improve, supply that previously could not reach customers can become saleable. A bottleneck can move; it is not a permanent wall.
Separate fab buildings, front-end equipment and back-end capacity. A conversion is not automatically a net capacity addition, and capital expenditure is not the same as shipped good bits. Product mix, yield and technology transitions affect output even without a new factory.
SK hynix’s cited release discusses M15X and Yongin investments. Kioxia and Sandisk also announced anticipated joint investment exceeding $31 billion through 2032, contingent on government support. Their shared venture must not be counted as two independent announcements of the same capacity.
Micron’s latest remarks forecast supply constraints in calendar 2027 and 2028. That is a meaningful multiyear management outlook, rather than an already observed outcome.
Timing is the central issue. Supply may fail to catch next quarter’s demand yet respond materially several years later. Investment approved during today’s shortage can arrive alongside competing expansions. The claim that the present shortage is real and the claim that the same shortage persists indefinitely require different evidence.
A useful supply bridge tracks wafer starts, good bits per wafer, product allocation, qualification and delivery. NAND layer increases and DRAM process improvements can change bits per wafer; shifts into more demanding products can offset some gains. A single factory-spending number cannot resolve that balance.
A 30% increase in volume can still produce lower profit
Consider a deliberately simple model. Start with volume of 100 units, a selling price of 1, variable cost of 0.60 per unit and fixed costs of 20. Revenue is 100, variable costs are 60 and operating profit is 20.
Now increase volume by 30% to 130 and reduce variable cost per unit by 15% to 0.51. If the selling price falls 25% to 0.75, revenue becomes 97.5, variable costs become 66.3 and operating profit falls to 11.2. That is a 44% decline in profit despite more units and lower unit costs.
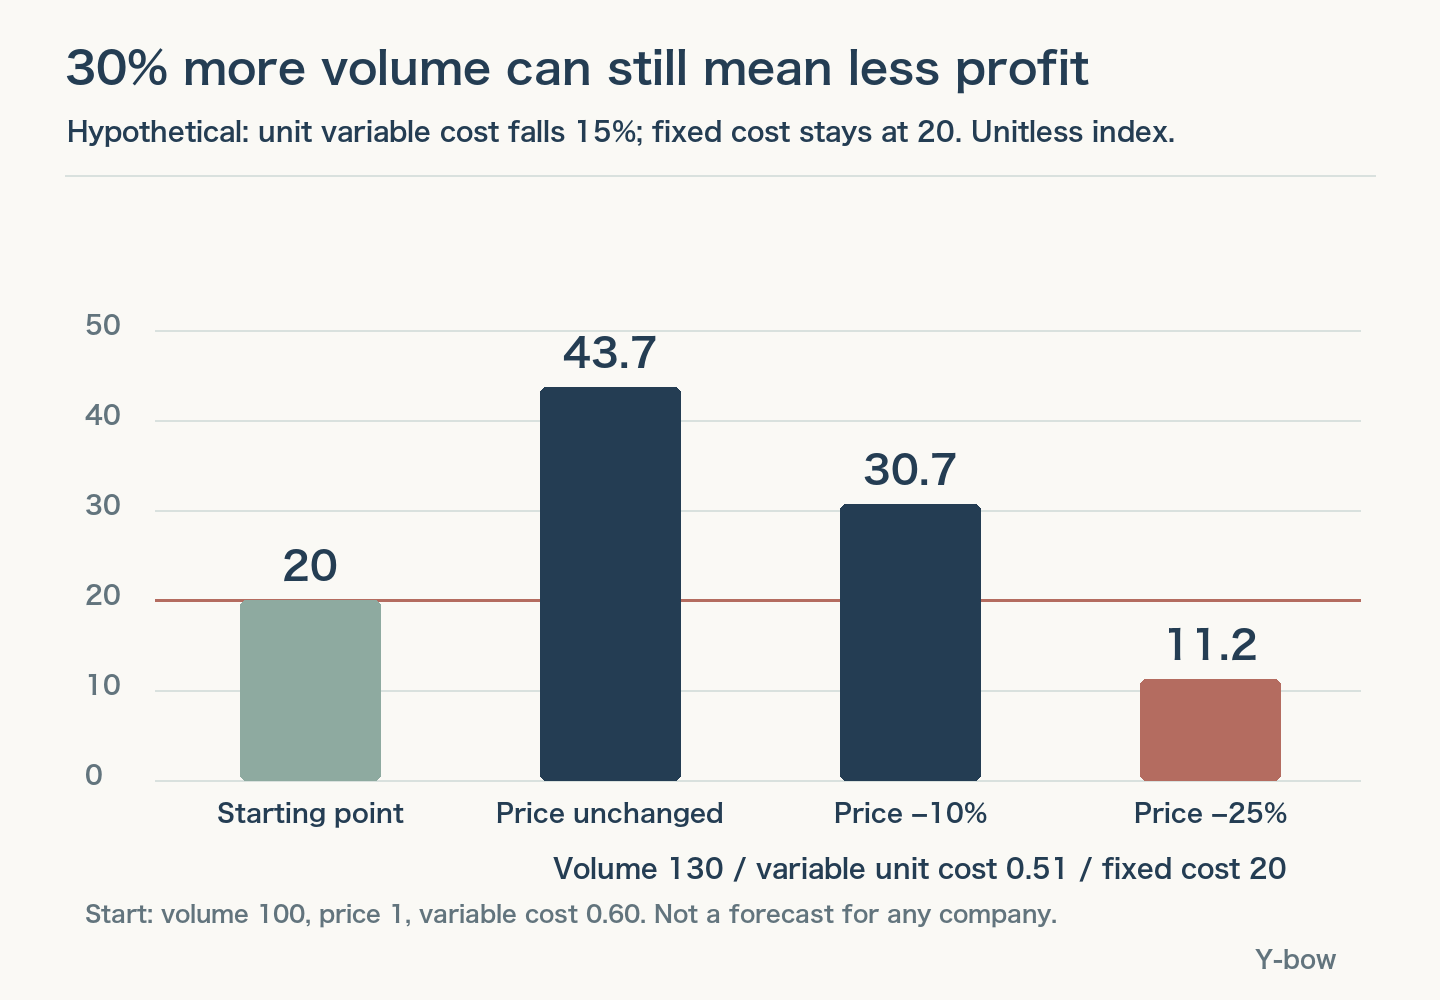
This model assumes the additional units are sold and fixed costs do not rise. It excludes inventory charges, taxes, interest and capital expenditure. Real expansion can add depreciation and start-up costs. Its purpose is to isolate pricing leverage, not to reproduce any company’s reported margins.
This is why contract floors can matter economically. But only the relevant portion of sales receives that protection, and the floor must be compared with future costs. Counting bits is the beginning of an earnings model, not the conclusion.
Five conditions for a more durable memory supercycle
1. End usage must support repeat purchasing
Look beyond orders to installed capacity being used and customers generating enough value to keep purchasing. Advance orders placed to avoid shortages can create a later gap. Supplier shipments and final consumption are related, but they are not identical.
2. Contracts must protect downturn economics
Track enforceable volume, pricing floors, payment support and actual performance through weaker conditions. Contract duration alone is insufficient. Renewal terms and customer creditworthiness also matter; a multiyear document cannot manufacture profitable end demand.
3. Supply must be paced against recoverable investment
Discipline should appear in commissioning schedules and equipment deployment, not just in management vocabulary. Spending less is not automatically better if it sacrifices competitiveness. The question is whether the next unit of investment earns an adequate return under less favorable pricing.
4. Differentiation must survive in realized prices and margins
Bandwidth, power efficiency, reliability and qualification can have real customer value. Investors need evidence that suppliers retain part of that value. Technical leadership that is rapidly matched by competitors may deliver volume growth without lasting pricing power.
5. The next trough must leave cash after investment
Compare operating earnings, operating cash flow, cash after capex and returns on invested capital across the next adjustment. A higher peak is encouraging. A higher trough is the stronger test of reduced cyclicality, and it cannot be conclusively demonstrated before that adjustment occurs.
| Quarterly check | Evidence supporting durability | Evidence that weakens the thesis |
|---|---|---|
| Contracts | Clear coverage and performance against minimum terms | Deferrals, renegotiations or weaker unprotected pricing |
| Inventory | Healthy turnover alongside shipped demand | Inventory or receivables growing faster than sales |
| Supply | Staged additions matching final demand | Simultaneous ramps and accelerating price pressure |
| Cash generation | Cash and returns hold above prior troughs | More capacity sold but weaker returns after investment |
| Customers | More independent sources of paid demand | Shared budget exposure and major-customer delays |
This is a research checklist, not an automatic trading system. Inventory can rise for legitimate product ramps, for example. The next step is to investigate why a metric changed and whether that explanation fits the rest of the accounts.
A better memory business can still be an overpriced stock
An investment thesis should specify which revenues are protected, for how long and under what cost assumptions. Separately, estimate what the stock price already assumes about sustainable margins. Exceptional earnings can disappoint a market that expected even more. A short-term price correction can also coexist with improving long-term contracts.
Buybacks introduce another layer of supply and demand in the shares themselves. They should not be confused with the operating cycle; see our comparison of memory-company buybacks and index flows. Infrastructure constraints beyond memory also matter, including water use and cooling in AI data centers.
Memory supercycle FAQ
Does an HBM shortage prevent memory stocks from falling?
No. Stock prices reflect future supply, pricing, margins and valuation. A real current shortage can coexist with a falling stock, and HBM conditions do not describe every DRAM or NAND product.
Do long-term agreements make memory non-cyclical?
They can reduce exposure if their coverage and terms protect profitable volumes. A volume commitment without equivalent pricing protection differs from a floor-and-ceiling arrangement. Costs, execution and renewal terms remain relevant.
When do robotics and space become major earnings drivers?
There is no single defensible date from these disclosures. Separate sampling, design selection, production shipments and material revenue. The existence of a use case is not a deployment forecast or evidence of marketwide pricing support.
Sources, calculations and update policy
Sources checked October 18, 2026. Operating margins are consolidated GAAP operating income divided by revenue. Revenue changes use the following year divided by the preceding year, minus one. All charts are original; hypothetical models are neither company guidance nor share-price forecasts.
- Samsung FY2017 results / 2018-01-31
- Samsung FY2018 results / 2019-01-31
- Micron FY2019 results / 2019-09-26
- Micron FY2023 results / 2023-09-27
- Micron FY2026 Q4 prepared remarks / 2026-09-30
- Micron FY2026 Form 10-K / 2026-10-09 audit report
- SK hynix 2Q2026 results / 2026-07-29
- Samsung 2Q2026 results / 2026-07-30
- Sandisk FY2026 Q4 results / 2026-08-05
- Kioxia Investor Day strategy / 2026-06-02
- Kioxia/Sandisk investment / 2026-08-27
- Kioxia ISS deployment / 2024-01-31
- Micron/Ford strategic agreement / 2026-07-06
Future updates should prioritize contract performance, saleable new supply, product pricing and costs, and cash generation during a pricing adjustment. This framework does not prescribe a particular security purchase or sale.








Comments