

The difficult question about a stock-market crash is not simply when the chart gets back to its old high. It is what happens to someone who must sell investments while waiting.
The Nasdaq-100 makes that distinction worth taking seriously. It holds large nonfinancial companies listed on Nasdaq, with substantial exposure to businesses whose prices can be sensitive to growth expectations. Its past success does not make it interchangeable with a retirement spending account.
This article uses the dot-com collapse as historical context, then works through a small, reproducible withdrawal example. The numbers in the example are invented. They are not a backtest, a forecast or an estimate of a safe withdrawal rate.
What the dot-com crash teaches about Nasdaq-100 risk
Nasdaq’s own discussion of its index history describes a decline of more than 80% between early 2000 and late 2002. That was a peak-to-trough loss, not a one-calendar-year return. The distinction matters when comparing a chart with annual performance tables. Source: Nasdaq.
A fall of 80% turns 100 into 20. Returning from 20 to 100 requires a 400% gain. It is therefore possible to have an impressive rebound and remain far below the starting value. A 100% gain from 20 only reaches 40.
Dates and return definitions also matter. A price index excludes reinvested dividends; a total-return index includes them under specified assumptions. A fund has expenses and may distribute income. Your account can have taxes, deposits, withdrawals and currency changes. None of these is captured by saying that “the Nasdaq recovered.”
Sequence risk: why selling changes the recovery calculation
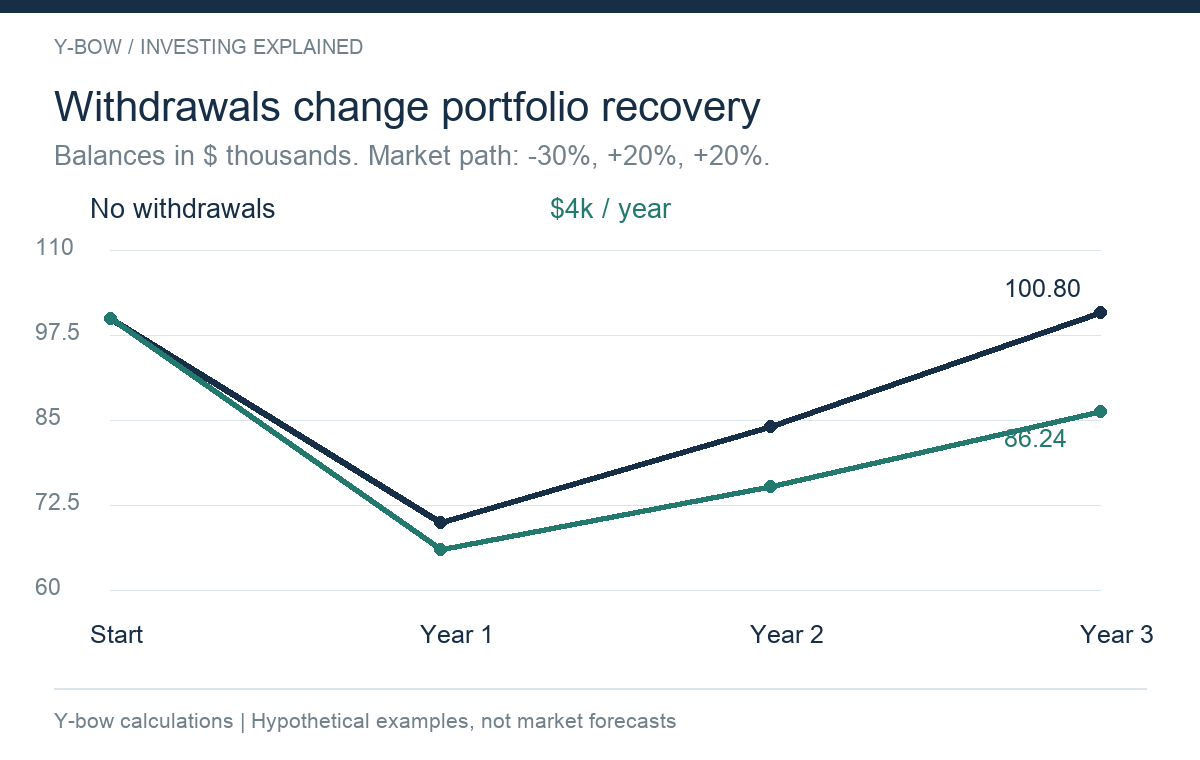
Suppose you start with $100,000 and withdraw $4,000 at each year-end, after the market return. The three annual returns are −30%, +20% and +20%. Ignore fees, taxes, inflation and interest.
| Year | Opening balance | Market return | Balance before withdrawal | Withdrawal | Closing balance |
|---|---|---|---|---|---|
| 1 | $100,000 | −30% | $70,000 | $4,000 | $66,000 |
| 2 | $66,000 | +20% | $79,200 | $4,000 | $75,200 |
| 3 | $75,200 | +20% | $90,240 | $4,000 | $86,240 |
With no withdrawals, the same market path ends at $100,800: 100,000 × 0.70 × 1.20 × 1.20. The market has slightly exceeded its initial value, but the spending portfolio has not. Some of the money that could participate in the rebound has already been spent.
That is not a mistake in the arithmetic. Paying the bills was the purpose of the money. The planning mistake would be to use an untouched index chart as if it represented a household making withdrawals.
Fixed withdrawals versus a percentage of the portfolio
Now withdraw 4% of the balance after each year’s return instead of a fixed $4,000. The percentage is merely an illustration, not a recommendation.
| Year | Fixed-dollar withdrawal | Percentage withdrawal | Fixed-dollar closing balance | Percentage closing balance |
|---|---|---|---|---|
| 1 | $4,000 | $2,800 | $66,000 | $67,200 |
| 2 | $4,000 | $3,225.60 | $75,200 | $77,414.40 |
| 3 | $4,000 | $3,715.89 | $86,240 | $89,181.39 |
Percentage withdrawals leave more invested here because they deliver less spending: about $9,741 rather than $12,000 over three years. They have not created a free improvement. A household with a fixed rent payment may not be able to accept that reduction.
This is why discussions of withdrawal rules need two results: the money remaining and the spending actually delivered. Comparing only the final balance rewards a strategy for withholding income the household needed.
Can a cash buffer protect a Nasdaq-heavy portfolio?
It can reduce the need to sell shares during a decline, but it changes the starting allocation and has an opportunity cost.
Take the same $100,000, with $80,000 invested and $20,000 in cash. Apply the same stock returns and pay $4,000 a year from cash. Assume cash earns nothing. After three years the stock portion is $80,640 and cash is $8,000, for a total of $88,640.
That exceeds the all-stock, fixed-withdrawal result in this particular path. It does not prove that cash always wins. If stocks rise immediately, the smaller stock position participates less. If a decline lasts longer than the buffer, the investor may still need to sell. Interest, inflation and taxes also affect the comparison.
A useful buffer is tied to spending and replenishment rules. “Keep some cash” leaves unanswered when to refill it, from which assets, and what to do if markets remain weak.
A Nasdaq-100 fund is not the same as a diversified retirement plan
Owning many stocks reduces dependence on one company, but it does not eliminate common exposure to growth valuations, industry conditions or U.S. markets. Adding another fund with the same large holdings may change the label more than the exposure.
Compare actual holdings and weights, then consider what pays near-term bills. The SEC’s asset-allocation guide explains why time horizon and tolerance for losses belong in that decision. Source: SEC.
Currency matters too. A dollar portfolio funding expenses in euros or pounds has an additional source of uncertainty. A U.S.-listed fund does not automatically match the currency of the investor’s future spending. Account eligibility, taxation and investor protections depend on residence and the specific product.
Why daily leverage makes the withdrawal problem harder
A daily leveraged Nasdaq fund adds another calculation. Its objective is a multiple of daily returns, not a fixed multiple of the index’s recovery over years. Fees, financing and daily compounding can change the result substantially. Source: SEC investor alert.
If you also withdraw money, the daily fund path and the account cash flows interact. A chart of an unleveraged index cannot establish whether a leveraged withdrawal strategy survives. A test would need the actual fund’s available history, transparent assumptions for any simulated earlier period, and the timing of each withdrawal.
For the separate recovery arithmetic, see S&P 500 crashes and portfolio recovery. The same distinction between a market and a spending account applies even when the benchmark differs.
A practical withdrawal stress test
Start with the annual spending the portfolio must actually cover after other income. Separate essential bills from spending that can be postponed. Then test an early decline, several weak years, inflation and a currency move, rather than only a smooth average return.
Record the withdrawal date, whether spending rises with inflation, how cash is replenished and which assets are sold. Report shortfalls as well as ending wealth. A plan that avoids a low balance by failing to pay tuition or rent has not met its objective.
The useful question is not whether the Nasdaq-100 eventually recovers in a chosen chart. It is whether your plan can keep paying for your life without relying on a recovery date nobody knows.
Information checked October 15, 2026. Historical observations and hypothetical calculations are identified separately. This article explains investment mechanics and does not recommend a personal allocation.








Comments