

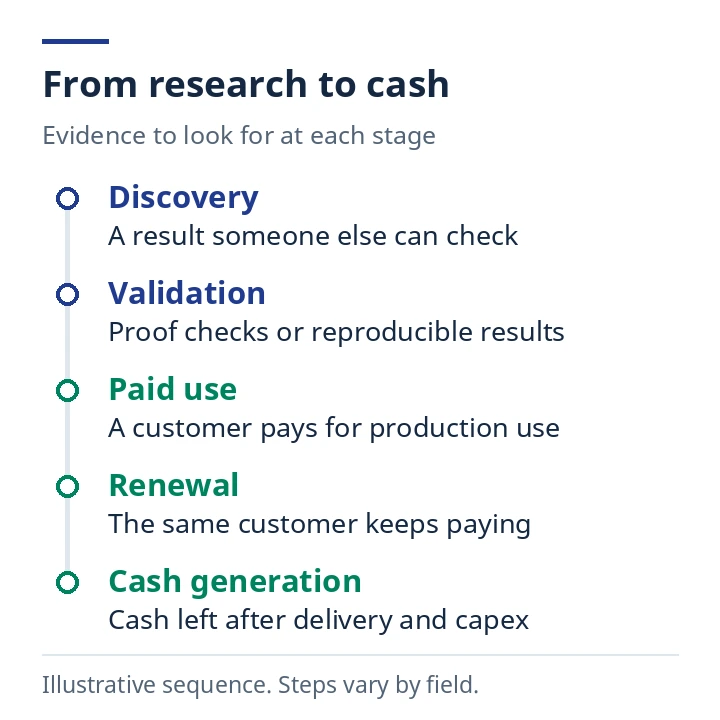
A research team can make a genuine breakthrough and leave investors with a hard question: who can charge for it, and what will it cost to keep delivering it? Start with a paying customer. Then look for renewal or expansion, the cost of producing a result the customer can use, and the cash left after investment. Those are three different tests, and a company can pass the first two while failing the third.
This guide shows how to read AI-for-science earnings across compute infrastructure, model and verification providers, and companies that sell the end application. It includes an example you can recreate from an income statement and a cash flow statement, plus a short list of conditions that would change each investment thesis.
What the Riemann proof checks tell us
On November 20, 2026, mathematician Levent Alpöge announced that he and Claude had obtained a proof of the Riemann Hypothesis and released a formalization in Lean. In a November 21 joint statement, the Lean and Mathlib communities reported that the theorem matched Mathlib’s vetted statement and that the exported proof passed checks by Lean’s kernel and several independently implemented checkers. MIT mathematician Andrew Sutherland has posted a separate record of the verification work. [1] [2] [3]
A proof checker tests whether the formal steps establish the specified conclusion from the stated foundations. Matching the statement matters because a valid proof of a different theorem would leave the original problem open. A human-readable account, peer review and a Millennium Prize decision are separate milestones. The Clay Mathematics Institute requires publication in a qualifying outlet, a wait of at least two years after publication, and general acceptance by the global mathematics community before it will consider a proposed solution. [2] [4]
For investors, it is worth asking what a customer will pay to have a result checked and made usable. In drug discovery, an earlier candidate still has to go through experiments and, where applicable, preclinical testing, human trials and regulatory review. A faster search for a candidate can be valuable while leaving the largest costs and risks farther down the road. [7]
Where the money goes across the AI-for-science value chain
Picture a research customer paying to use a model hosted on rented compute. The model vendor records revenue from the customer. The model vendor’s payment for compute is an expense on its side and revenue for the infrastructure vendor. If the customer owns the validation data or the route to market, it may keep much of the value even when it buys someone else’s model. Following the payments helps avoid counting the same spend twice.
| Layer | Payer and purchase | What to track | Where margins can erode |
|---|---|---|---|
| Compute infrastructure | Research organizations and model vendors buy compute, hosting or hardware. | Utilization, customer concentration, reinvestment, operating cash flow and cash capex. | Excess capacity, cheaper compute, higher power costs or financing costs. |
| Models and verification | Customers pay for model access, integrated workflows, testing or audit services. | Paid production usage, renewals, cost per accepted result and gross margin. | Easy switching, expensive rework and review, or unused minimum compute commitments. |
| Applications | End users buy a product or service. Research partners may also pay at contractual milestones. | Renewal, product versus collaboration revenue, cash receipts, ongoing R&D and FCF. | One-off milestones, delayed validation or review, and cost savings passed on to buyers. |
Where should you look for pricing power? Ask whether customers can switch to a cheaper model, whether they can take their data and workflows with them, and who owns the evidence needed to use the output. If cheaper inference gets passed through in lower prices, customers can get a bargain while vendors keep little of the savings. A vendor that charges per completed workflow may have a different outcome from one that sells interchangeable tokens.
Six things to look for in the next earnings release
- Paid production use. Start with paying customers or billable usage in production. If management combines trials and deployments, keep them in separate columns in your notes and mark any unavailable split.
- Renewal and expansion. Look for the same customers renewing or using the product in more workflows. Track the cohort and the measurement period. Companywide growth can come from new customers while older customers spend less.
- Inference economics. Measure the cost of delivering one result that meets the customer’s acceptance criteria. Include repeat attempts and review time where they are material. Hold workload difficulty and quality requirements steady when comparing methods.
- Gross margin. Divide revenue less cost of revenue by revenue, for a consistent business and period. Look for changes in pricing, workload mix and delivery cost. Check where the company records training, customer-serving compute and allocated infrastructure.
- Capital intensity. Check cash purchases of property and equipment. Read the separate disclosures for leases, prepayments and minimum purchase obligations. The headline size of a commitment tells you little about the cash due in any one quarter.
- Free cash flow. Start with cash from operating activities less cash purchases of property and equipment. Reconcile any company-defined FCF, then check for material lease or prepayment outflows elsewhere in the statement. Keep a payment already included in operating cash flow from being counted again.
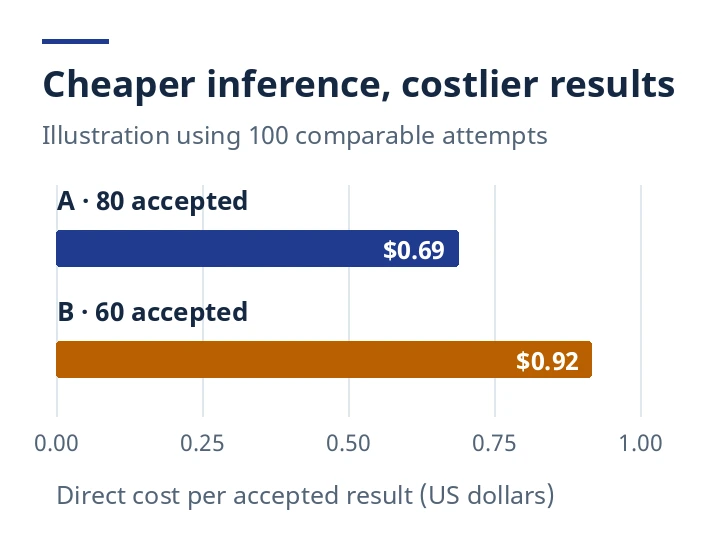
Here is a small test for inference. Suppose workflow A spends $40 on compute and $15 on review across 100 attempts. The team accepts 80 results, so the direct cost is about $0.69 per accepted result. Workflow B brings compute down to $25 but needs $30 of review, and only 60 results pass. The same $55 now buys fewer useful results, at roughly $0.92 apiece. These are illustrative costs. Most financial filings will give you only part of the information needed to calculate this metric.
How revenue can rise while free cash flow falls
Take a hypothetical vendor with 100 units of revenue and 45 of cost of revenue in period A. In period B those figures rise to 140 and 77. Gross profit increases from 55 to 63, but gross margin falls from 55% to 45%. Operating cash flow also improves, from 35 to 43. Cash purchases of equipment climb from 30 to 50, leaving FCF at −7, down from +5.
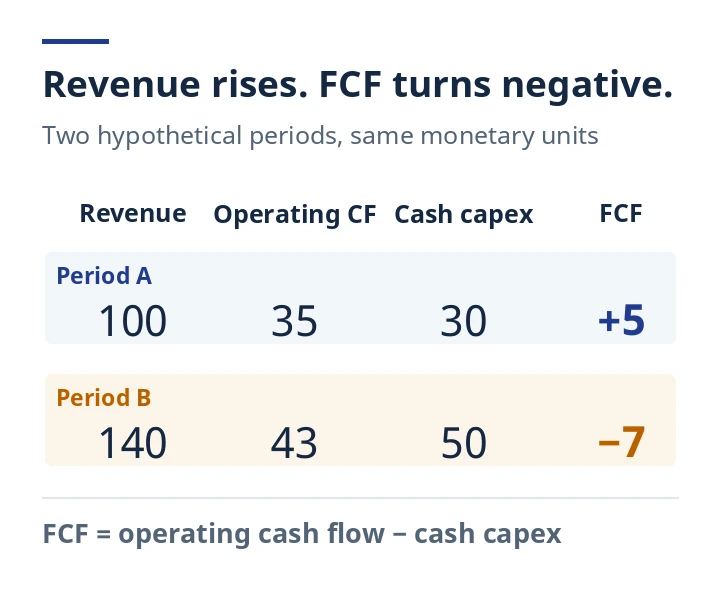
The next question is whether the new capacity earns its keep. In subsequent filings, look for paid utilization, a lower cost per accepted result and evidence that growth generates cash across several periods. Advance payments and the timing of supplier bills can lift or depress operating cash flow in a single period. Working capital and the capex schedule help explain the change.
Two filings to practice on
Model vendor — Anthropic. The issuer’s November 18, 2026 pricing document and the final prospectus filed November 19 report an IPO offering price of $83 per share. For the earnings question, go to the final prospectus’s management discussion and expense notes. It says customer-serving compute and infrastructure make up substantially all cost of revenue, while compute used for model development and research appears primarily in R&D expenses. Then look up the compute commitments and lease terms. Companywide disclosures do not isolate any revenue or profit attributable to the Riemann work. [5] [6]
Application company — Recursion. Its September 2026 quarter 10-Q reports a $10 million milestone in a Sanofi research collaboration for a development candidate. Start with the collaboration notes. Check what triggered the milestone, how revenue is recognized, when cash is received and what still has to happen before product sales. A milestone can pay for an advance well before any drug that comes out of the project reaches the market. [8]
Bull, base and bear cases, and what would change them
| Case | What you would expect to see | What breaks the case |
|---|---|---|
| Bull | Multiple paying customers deploy and renew. Comparable delivery costs fall and FCF improves across periods. | Price concessions absorb the savings, or margins and cash keep deteriorating despite adoption. |
| Base | Some workflows renew. Discounts and implementation costs leave a lag between growth and cash generation. | Wider adoption and durable cash improvement move the case up. Weak renewal and a mounting cash burden move it down. |
| Bear | Few pilots convert, rework is costly and idle committed capacity consumes cash. | Renewals broaden beyond a single customer and margin and multi-period FCF improve without sustained discounting. |
Before the next filing, write down the payer, two measures you can actually observe, and one finding that would change your mind. For a model vendor, that could mean deeper use among existing paying customers and a better margin on comparable workloads. If the segment cannot be isolated, say so and use the company’s explanation of delivery costs as a weaker clue. Finally, ask what growth is already priced into the stock. A promising business can still disappoint investors if earnings fall short of the expectations they paid for.
Related guides
- AI cloud backlog, RPO and cash flow for the gap between a commitment and cash collection.
- AI capex, GPU depreciation and free cash flow for the difference between cash spending and the expense recognized over time.
- Speculative decoding and inference performance for the technical conditions that can make inference faster.
Primary sources
Sources checked November 22, 2026 (Japan time). The illustrations are original. The worked examples use hypothetical data and make no forecast.
- Levent Alpöge’s announcement, November 20, 2026 — Initial announcement and collaboration
- Lean and Mathlib joint statement, November 21, 2026 — Statement match, build reproduction and independent checking
- Andrew Sutherland’s verification record (MIT), updated November 22, 2026 at 04:35 UTC — Statement comparison and checking logs
- Clay Mathematics Institute’s prize rules, revision adopted September 26, 2018 — Publication, elapsed time and general acceptance
- Anthropic issuer pricing document, dated November 18, 2026 — IPO offer price, separate from trading prices
- Anthropic final prospectus, Form 424B4, filed November 19, 2026 — MD&A, compute cost classification, commitments and leases
- US FDA’s overview of the drug development process — Discovery, preclinical and clinical research, and review
- Recursion Form 10-Q for the September 30, 2026 quarter, filed November 2 — Milestones, revenue recognition and receipts






Comments