You own an S&P 500 fund to diversify, but a market map is dominated by a few enormous companies. Equal-weight RSP can look like a simple escape: keep the same familiar index and reduce dependence on its biggest names. What does that change actually buy—and what does it leave in place?
Official sources were checked on October 31, 2026. This article clearly separates a Vanguard portfolio snapshot from our hypothetical 500-company model. We have not obtained complete aligned holdings for both funds, so our model figures are not presented as current RSP or VOO weights or performance.
RSP and VOO: the same company universe, different weighting
VOO seeks S&P 500 exposure; RSP targets the equal-weight version. Changing the weights changes the contribution each company can make even when the investable company universe is broadly the same. See Vanguard’s official fact sheet and Invesco’s RSP product description.
S&P Dow Jones Indices describes quarterly resets to approximately 0.2% per constituent company. This is not a claim that each holding stays exactly equal between resets. Price movements make weights drift. Company counts also differ from security-line counts when one company has more than one share class.
What VOO’s reported 40.6% top-ten concentration means
Vanguard’s September 30, 2026 sheet reports 40.6% of VOO in its ten largest companies. Its rounded company entries include NVIDIA at 8.4%, Apple 7.4%, Microsoft 5.8% and Alphabet 5.5%. Information technology is reported at 39.7%. Rounded entries can sum slightly differently from the reported aggregate.
A sector label and an economic exposure are not identical. Businesses with related drivers can sit in different classifications, so a technology-sector percentage alone does not resolve the concentration question. Look at company-level and sector-level weights, and state whether share classes have been combined before comparing a “top ten.”
← Swipe to view the full table →
| Number | Meaning | Scope |
|---|---|---|
| VOO top ten: 40.6% | Official Vanguard snapshot | September 30, 2026 |
| Approximately 0.2% per company | Equal-weight reset principle | Not a current RSP holdings file |
| 40%, 2% and 21% below | Original model assumptions | Not actual fund weights |
Advertisement
An original model isolates the effect of changing weights
Imagine 500 companies. The cap-weight-style model assigns 4% to each of ten large companies, with the remaining 60% spread evenly across 490 companies. The equal-weight model assigns 0.2% to each of all 500. These deliberately simplified weights isolate the mechanism. They do not reproduce either fund’s portfolio.
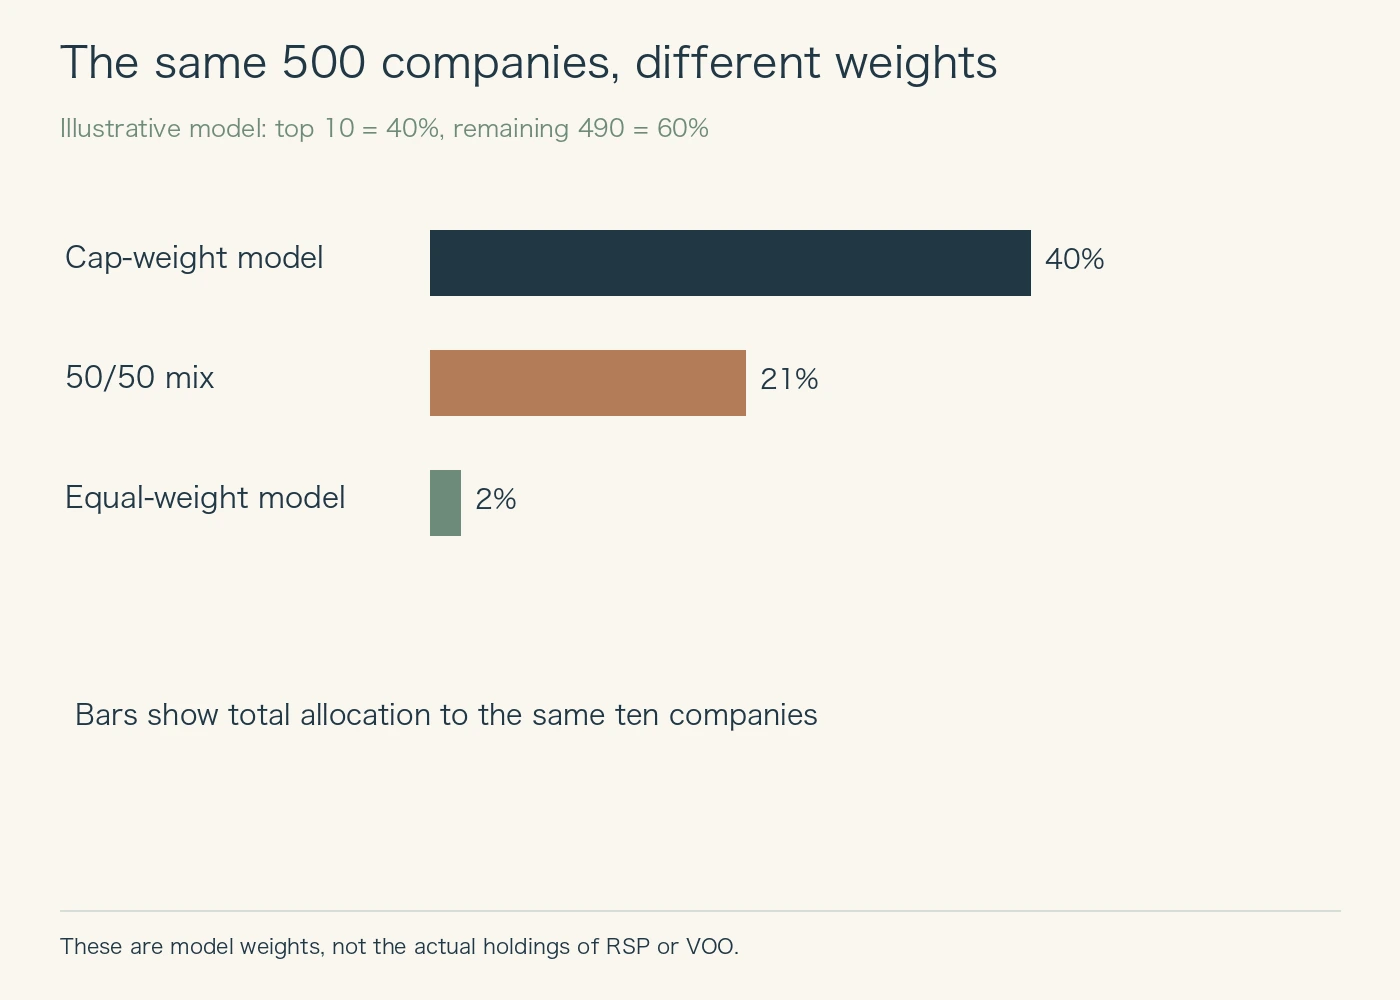
A 50/50 mix assigns (40% + 2%)/2 = 21% to those same ten companies. It adds no new company to this model universe, but it changes account-level exposure to the ten. “The holdings overlap, so adding it changes nothing” is wrong; “I now own two unrelated markets” is also wrong. The unit of diversification you mean matters.
Three shocks show the trade-off without forecasting a winner
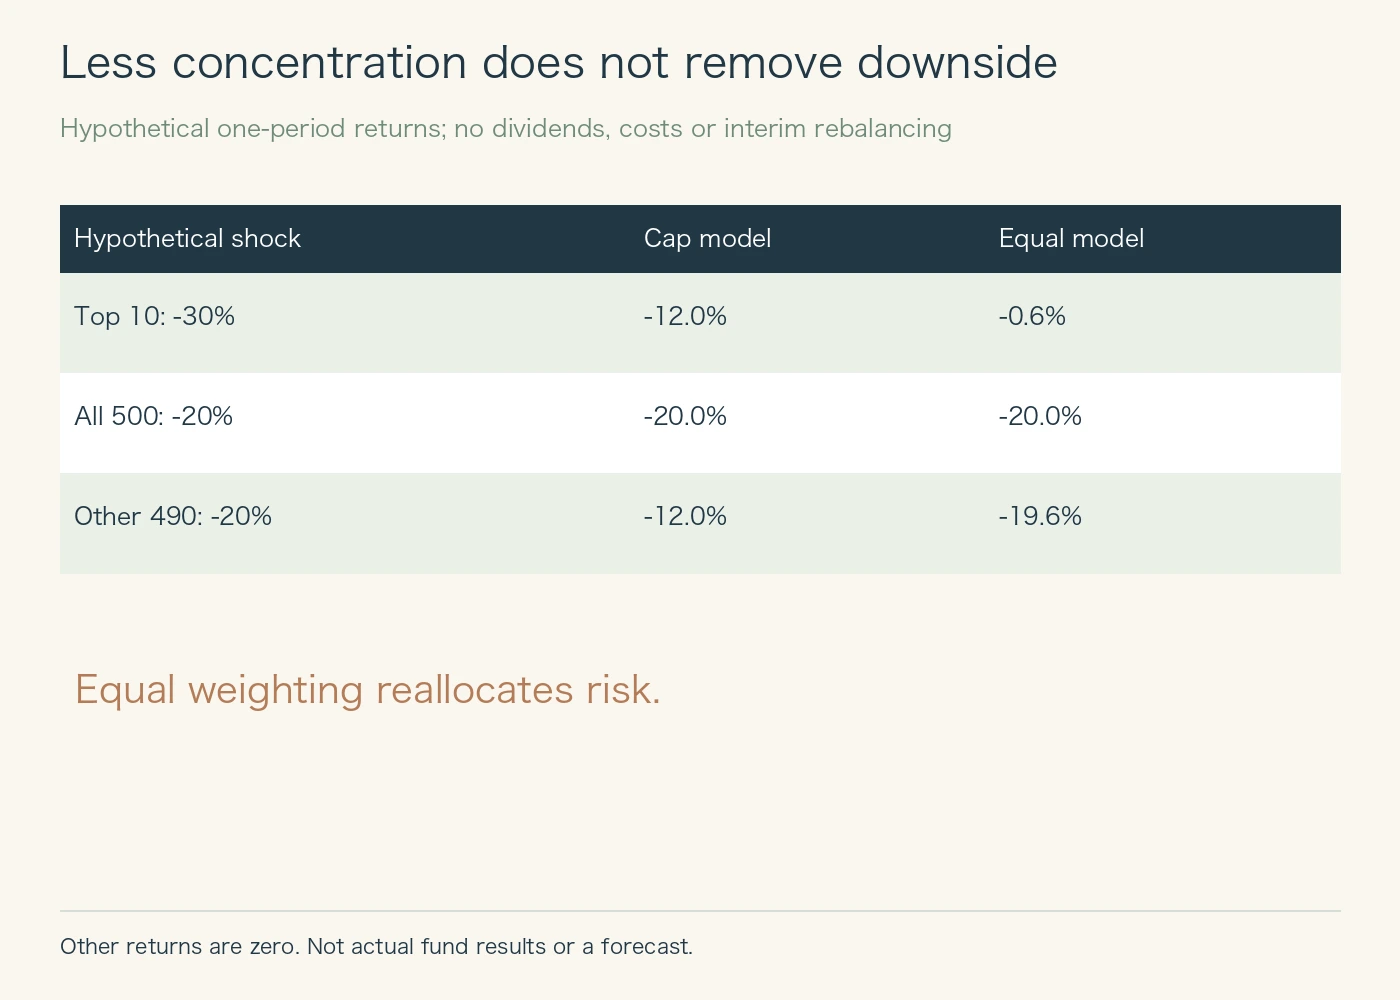
If only the ten large companies lose 30%, the cap model loses 12% and the equal model 0.6%. If all companies lose 20%, both models lose 20%. If only the other 490 lose 20%, the cap model loses 12% while the equal model loses 19.6%.
The third example is essential. Cutting reliance on mega-caps increases reliance on other businesses. A broad earnings contraction, financing shock or simultaneous equity selloff need not reward the same allocation that helps when a few former leaders fall. The figures specify exposures, not probabilities, and do not predict which event happens next.
Likewise, a period dominated by rising mega-caps can make the cap-weighted portfolio look better. Switching after a recent winner changes can turn a concentration decision into performance chasing. A durable holding rationale should explain what exposure you want before the next performance table appears.
Effective company count measures weights, not independent risks
The model’s concentration can be summarized with HHI: square each decimal weight and sum the results. Its inverse is an effective company count. The cap model is about 59.8; the equal model is 500; the 50/50 mix is about 175.9.
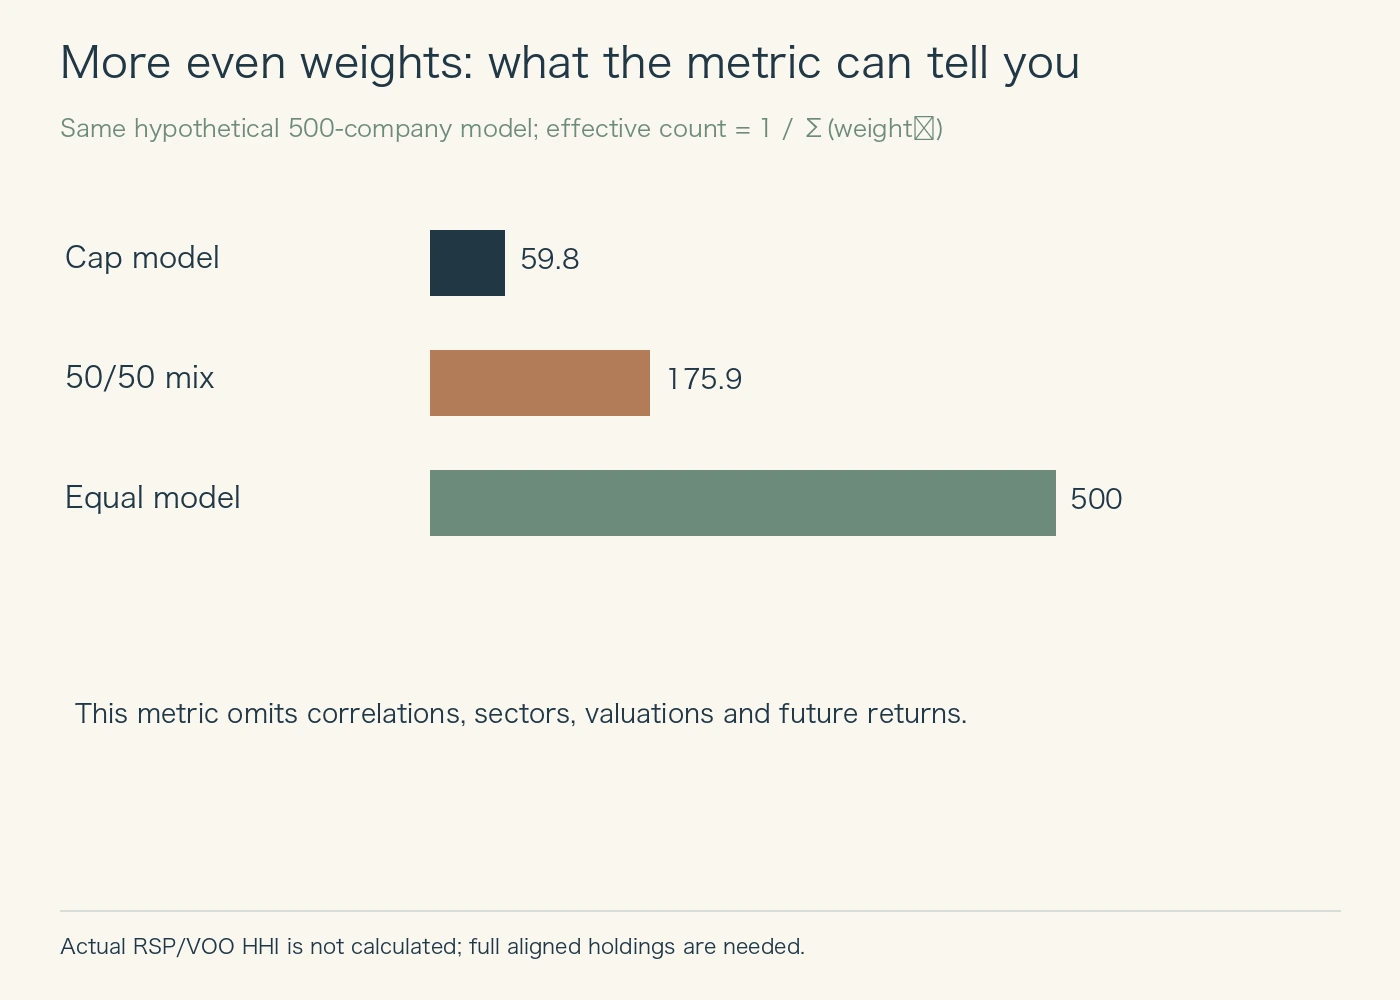
This calculation says how evenly capital is distributed. It does not say the companies are independent. It ignores correlations, earnings quality, valuation, currency and the circumstances of a future decline. A count of 500 is not 500 independent safe assets. Calculating actual fund HHI would require complete same-date weights and an explicit share-class aggregation rule.
Related book (affiliate advertisement)
Background reading on diversification, trading costs and investment discipline. It is not presented as endorsing the specific orders or products discussed here.
A Random Walk Down Wall Street (English paperback)
View this edition on Amazon Japan
Check the linked page for price and availability. As an Amazon Associate, Y-bow earns from qualifying purchases.
Advertisement
What equal weighting does not diversify—and what to check
RSP does not add the entire US small-cap universe. It increases the relative influence of smaller companies within the S&P 500 universe. Equal company weights also do not produce equal sector weights: sectors containing more constituent companies can receive larger allocations. Think of this as a distinct allocation process, not the neutral version of stocks.
Periodic resets, fund expenses and your own transaction costs affect results. Vanguard’s cited sheet reports a 0.03% VOO expense ratio. The Invesco product screen checked on October 31, 2026 reports 0.20% for both RSP’s total and net expense ratios. The 0.17-percentage-point gap is $17 annually per $10,000 on a simple static calculation, not a forecast of the return gap. Spreads and investor trading conditions need separate evaluation; the observation dates should remain attached to each disclosure.
← Swipe to view the full table →
| Question | Evidence to check |
|---|---|
| What should decrease? | A company concentration or total equity downside? |
| What increases? | Relative smaller-company, sector and reset-rule exposure |
| Are costs included? | Current ongoing fees, trading costs and any sale-related tax |
| Can you retain the rationale? | Why hold it if mega-caps continue to lead? |
Related guides, sources and reproducibility
Our VT/VTI/VOO overlap guide addresses a different question: the investment universe. The present comparison is about the weights inside a familiar universe. It is not a forecast that equal weighting will outperform next year.
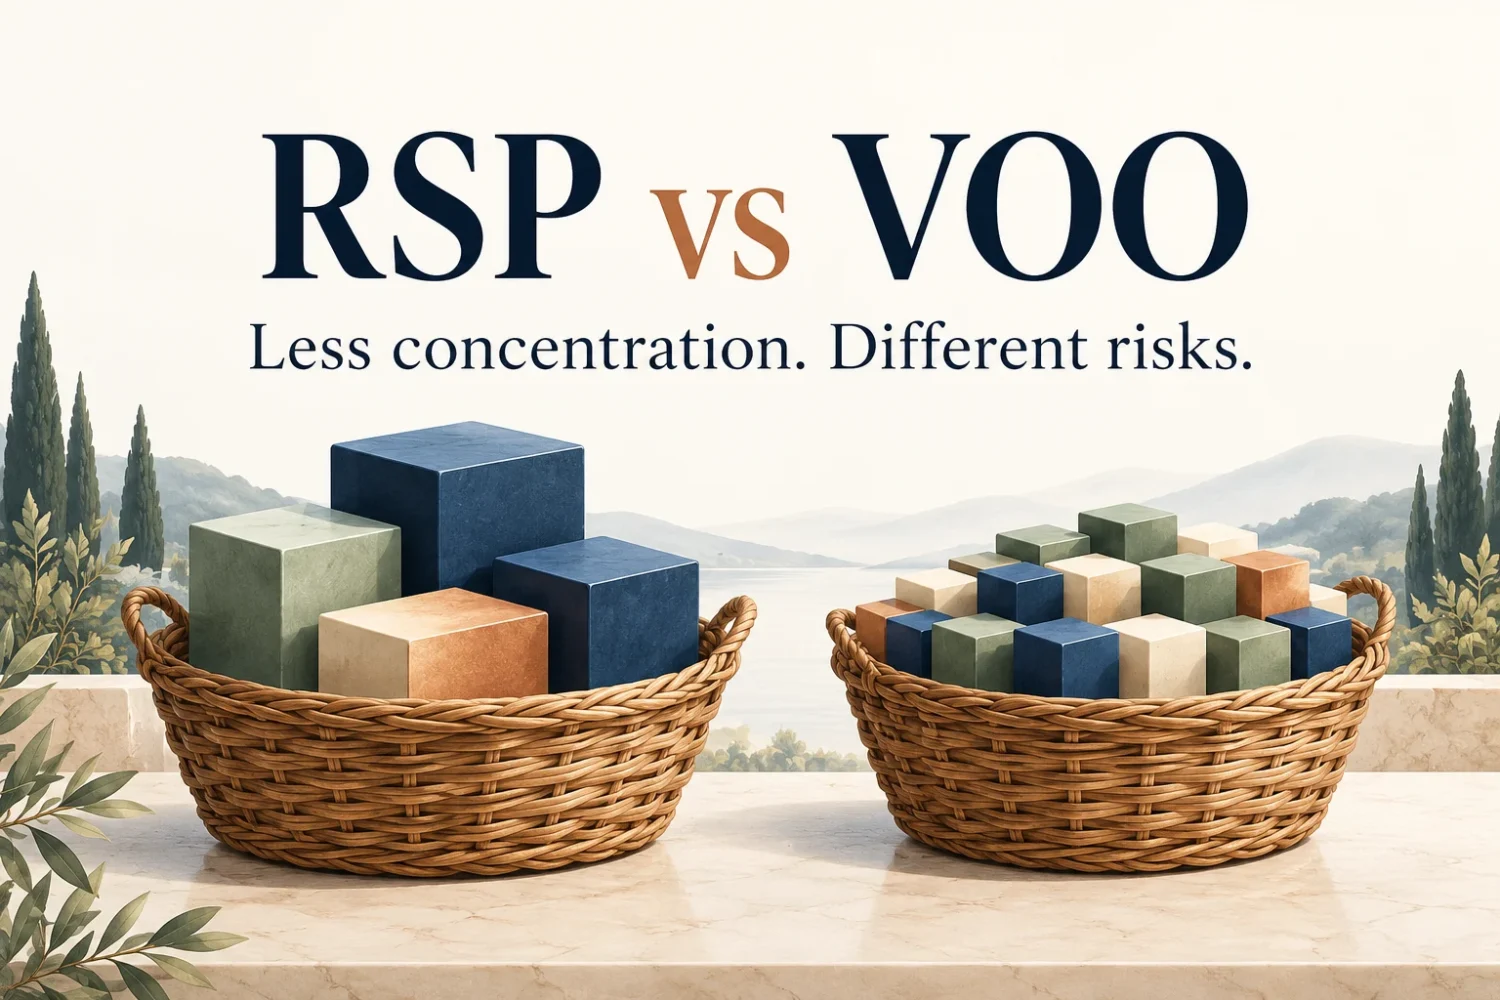
Model return equals the sum of starting weight times constituent return. HHI equals the sum of squared decimal weights; the mixed portfolio averages the two weight sets. There is no interim rebalancing. Observed data come from Vanguard’s September 30 sheet; index-method references are S&P and Invesco. We exclude an actual-fund HHI and a historical winner table because aligned complete data have not been established. Changes in methodology, costs or relevant holdings will prompt an update. The header is AI conceptual artwork; the three figures are original calculations.



Comments