
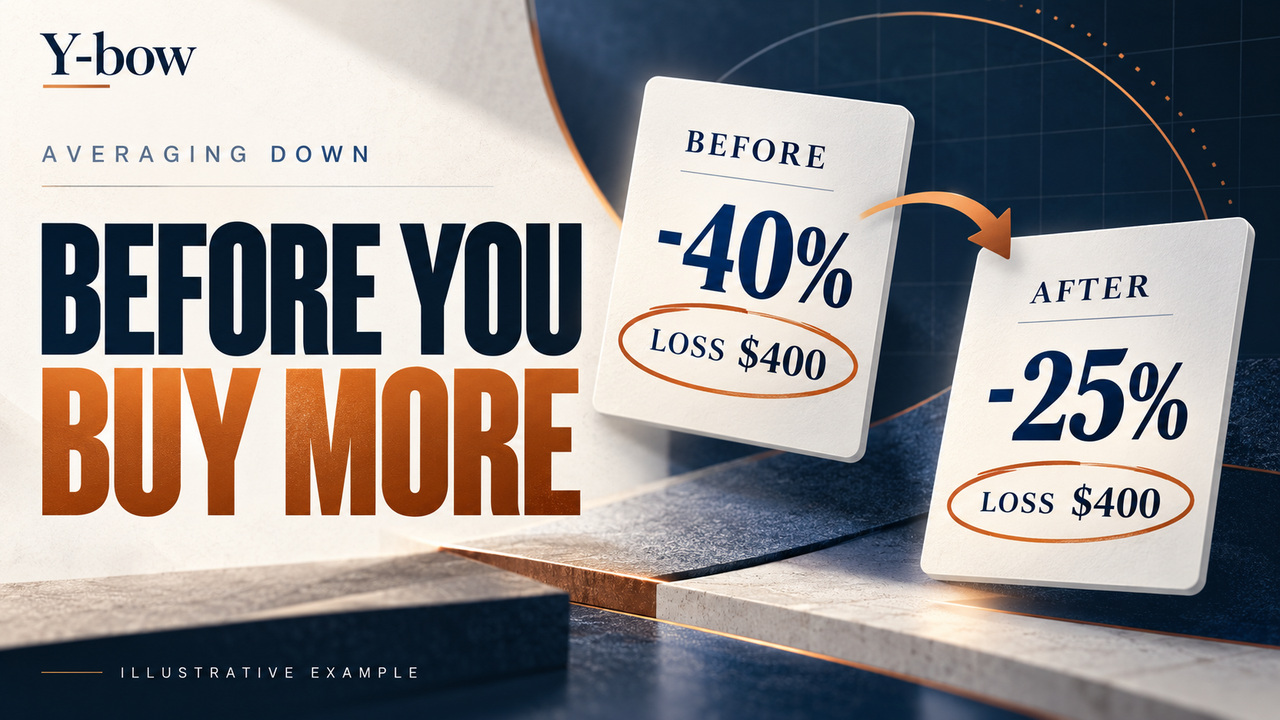
Averaging down can make an investment’s percentage loss look smaller without reducing its dollar loss at the moment you buy. The distinction comes from a larger cost base—and it matters before you commit more cash.
In this worked example, a position moves from −40% to −25%, while its unrealized loss stays at $400. Its exposure to the next price move increases.
Watch the visual walkthrough
Watch Does Averaging Down Actually Reduce Your Loss? on YouTube (6 minutes 26 seconds, with English captions). The worked tables below let you check each step at your own pace.
The starting position: 10 shares bought at $100
Imagine a fictional stock, quoted in US dollars. You bought 10 shares for $100 each. Your original cost is $1,000. The market price then falls to $60, leaving those shares worth $600.
The unrealized gain or loss is the current market value minus the purchase cost:
$600 − $1,000 = −$400.
Divide the loss by the amount invested to express it as a percentage: −$400 ÷ $1,000 = −40%.
What changes when you buy 10 more shares at $60?
You spend an additional $600 to buy another 10 shares at $60. This is averaging down: adding to an existing position at a price below your earlier purchase price.
You now have 20 shares, and the combined purchase cost is $1,600. Your average cost per share falls to $80:
($1,000 + $600) ÷ (10 + 10) = $80.
| Measure | Before the extra purchase | After the extra purchase |
|---|---|---|
| Shares owned | 10 | 20 |
| Total purchase cost | $1,000 | $1,600 |
| Average cost per share | $100 | $80 |
| Current market price | $60 | $60 |
| Position market value | $600 | $1,200 |
| Unrealized dollar gain/loss | −$400 | −$400 |
| Unrealized gain/loss ÷ cost | −40% | −25% |
Why does −40% become −25% if the loss is unchanged?
At $60 per share, your 20 shares are worth $1,200. Compare that with the $1,600 you invested: the loss is still $400. The percentage, however, now uses the larger $1,600 cost base.
- Before: −$400 ÷ $1,000 = −40%.
- After: −$400 ÷ $1,600 = −25%.
The numerator—the dollar loss—did not change. The denominator—the amount invested—grew. Both the lower average cost and the smaller percentage loss are mathematically correct. Neither means the original loss disappeared.
This comparison is a simple position-level calculation. Your broker may use different tax-lot methods or account performance measures. An unrealized loss is also distinct from a realized loss when you sell.
Follow the cash: no wealth is created by the purchase
Just before adding, suppose your resources are $600 of stock plus $600 in cash. Their combined value is $1,200. Just after adding, they are $1,200 of stock and no cash. The combined value is still $1,200.
The purchase changes the allocation of your resources. It does not create a $600 gain. The extra stock value came from cash you already had.
The next price move affects a larger position
With 10 shares, each $1 price change moves the position’s value by $10. With 20 shares, the same change moves it by $20. Averaging down therefore increases your dollar sensitivity to the next move.
| Future share price | No extra purchase: position gain/loss | Buy 10 more: position gain/loss |
|---|---|---|
| $50 | −$500 | −$600 |
| $60 | −$400 | −$400 |
| $70 | −$300 | −$200 |
| $80 | −$200 | $0 |
| $100 | $0 | +$400 |
At $50, buying more makes the loss $100 larger than it would have been without adding. At $70, it makes the loss $100 smaller. More shares participate in both the recovery and a further decline.
For a fair comparison of total wealth, include the unspent $600 on the no-purchase side. At $50, total wealth is $1,100 without adding versus $1,000 after adding. At $70, it is $1,300 versus $1,400. We assume the retained cash earns no interest. Comparing stock values alone would miss that cash.
A lower break-even price is not a recovery forecast
The combined position breaks even at an $80 share price, before costs and taxes. A move from $60 to $80 is a 33⅓% gain: ($80 − $60) ÷ $60. The original position needed a return to $100, a 66⅔% gain from $60.
A lower break-even target does not show that recovery is likely. The company’s future prospects, valuation and risks matter independently of your average cost. A price decline can reflect an opportunity, a deteriorating business, or a mixture of both. Arithmetic alone cannot decide which.
Questions to ask before committing more money
- Would I buy this investment today if I did not already own it? A wish to improve the displayed loss percentage is not evidence of value.
- What would change my investment case? Identify evidence that would challenge your view, including the possibility that it was wrong.
- How concentrated would my portfolio become? A bigger holding can make one outcome matter more to your overall wealth.
- When might I need the cash? Money committed to a falling asset is no longer available for other purposes.
- What are the alternatives and costs? Consider other investments, retaining cash, spreads, commissions, taxes and any borrowing risk.
These questions are a way to examine a decision, not a rule to buy or sell. Our example uses cash, not leverage.
Averaging down and dollar cost averaging describe different rules
Investor.gov’s definition of dollar cost averaging focuses on equal portions invested at regular intervals, regardless of market ups and downs. Averaging down describes adding below an earlier purchase price.
A scheduled purchase may happen at a lower price and therefore do both. But buying only because a holding has fallen is a different decision rule from following a preset schedule. Neither label guarantees a profit or prevents losses.
Read the cost, percentage and dollars together
In this example, average cost falls from $100 to $80, and the loss percentage improves from −40% to −25%. The dollar loss remains $400 at the purchase price, and the position doubles in share count.
Before buying more, check all three numbers—and the amount of exposure you will have afterward. A more comfortable percentage on screen is only one part of the decision.
Related visual investing guides
- ETF portfolio overlap: VT, VTI and VOO
- SOXL and the effects of daily leverage
- Trading costs for ETFs and mutual funds
Editorial note: All price scenarios and calculations in this guide are hypothetical and use US dollars. Calculations were independently checked with exact arithmetic. No market return is predicted. AI assists production; the explanation, assumptions and calculations are reviewed. Educational information only, not personalized investment advice.








Comments