
You bought the memory story because AI needs more memory. Then the shares fell, even as the earnings headlines improved. Suddenly, “demand is strong” no longer felt like a sufficient reason to keep the position.
That discomfort is understandable. An industry can grow while a particular investment disappoints. Samsung, SK hynix, Micron, Kioxia and Sandisk do not sell the same mix of products, face the same manufacturing constraints or carry the same expectations in their share prices. HBM shortages and NAND expansion can appear in the same news feed without contradicting each other.
I have 17 years of investing experience. One distinction I want to keep clear is the difference between believing in an industry’s growth and explaining why today’s position size and valuation make sense. This guide connects memory products, company business models, earnings and investment decisions. Its purpose is to make a holding thesis testable, including the facts that would make you reconsider it.
Five points to keep in view
- HBM is a type of DRAM. Adding HBM, all DRAM and NAND as three independent markets double-counts part of the industry.
- A memory stock can represent different exposures: HBM qualification, conventional DRAM pricing, NAND manufacturing or finished SSDs.
- AI spending becomes earnings through customer adoption, usable output, pricing, mix and costs.
- Record earnings and a low current P/E do not establish a cheap through-cycle valuation.
- A sound company thesis does not repair an oversized position or a household cash shortfall.
Sources checked October 17, 2026. Market charts use April–June 2026 research; financial periods and reporting scopes are identified individually. Company plans are not treated as completed results. Figures are original reconstructions or explicitly hypothetical calculations. This is an industry framework, not a price target or individualized recommendation.
HBM vs DRAM vs NAND vs SSD: start with the product hierarchy
Working memory and storage solve different problems. A desk and a bookshelf are useful analogies: one holds what you are working on; the other stores what you may need later. The analogy describes roles, not a measured ratio of speed, capacity or price.
DRAM mainly holds data used during processing and ordinarily loses its contents without power. NAND flash retains data without power. An SSD is a storage product built with NAND, a controller, firmware and other components; it is not a synonym for the raw memory chip. Kioxia’s explanation of NAND provides a useful starting point.
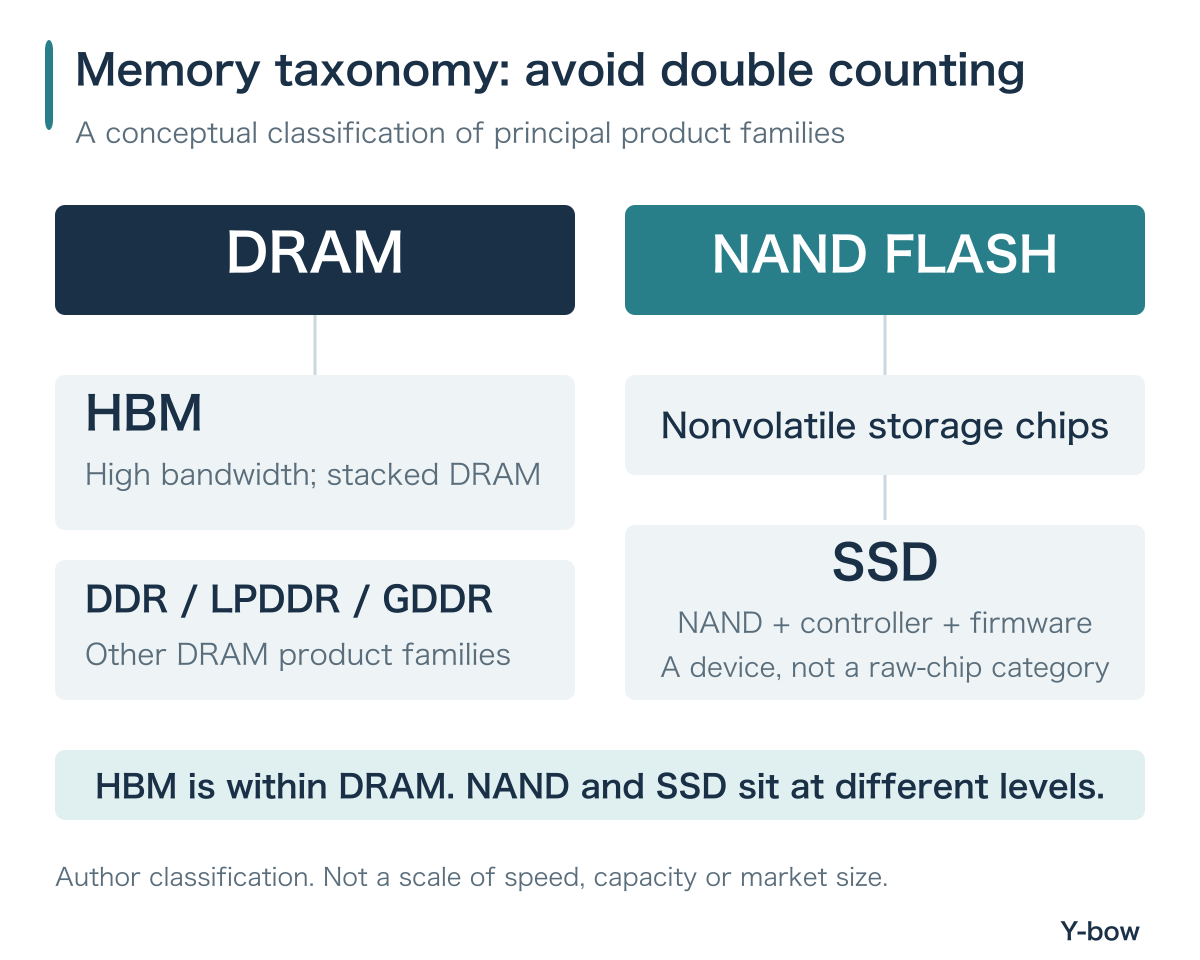
| Term | What it describes | Investor questions |
|---|---|---|
| DDR DRAM | Working memory for servers, PCs and other systems. | Generation, capacity, end market, pricing and bit shipments. |
| LPDDR | DRAM designed around low-power requirements. | Distinguish mobile uses from server adoption. |
| GDDR | DRAM used in graphics and other applications. | A GPU memory product is not automatically HBM. |
| HBM | Stacked DRAM designed for high bandwidth. | Qualification, shipments, stacking, interconnects, thermals and yield. |
| NAND | Nonvolatile memory used for storage. | Price per bit, process, TLC/QLC and usable-bit cost. |
| SSD | A finished storage device using NAND and control technologies. | Workload performance, endurance, firmware, adoption and mix. |
High bandwidth is not the same as high capacity
The B in HBM means bandwidth: how much data can move over time. It does not simply mean how much can be stored. A powerful processor can spend time waiting if its data supply is inadequate. Placing high-bandwidth memory close to the accelerator addresses a different constraint from adding bulk storage. Micron’s HBM4 product description discusses bandwidth, power and stacking as product attributes.
Adding a larger SSD does not provide an interchangeable replacement for the HBM next to a GPU. Latency, write behavior, interfaces and software differ. Memory and storage can serve the same AI deployment while remaining distinct markets. A forecast of HBM demand cannot simply be applied to a NAND supplier’s revenue.

NAND layer count and TLC/QLC describe different density choices
Stacking cells in 3D NAND and storing more bits in each cell are different approaches. TLC stores three bits per cell; QLC stores four. Kioxia’s multilevel-cell explanation describes the trade-offs involving capacity, read/write behavior and endurance.
The ratio of four to three does not prove that a finished QLC SSD must cost 25% less. Controllers, spare area, processing, usable yield and performance requirements still matter. Competition in cheap bits and competition in a qualified finished product overlap without being identical.
Also distinguish stacked DRAM dies in HBM from cell layers inside 3D NAND. Comparing those layer counts does not rank the technologies or their suppliers.
Memory industry company map: who competes in each business?
It helps to separate broad memory suppliers, NAND-and-storage-focused suppliers, and other DRAM or specialty-memory competitors. The following map describes product coverage. It is neither a revenue-mix estimate nor a score of technological leadership.
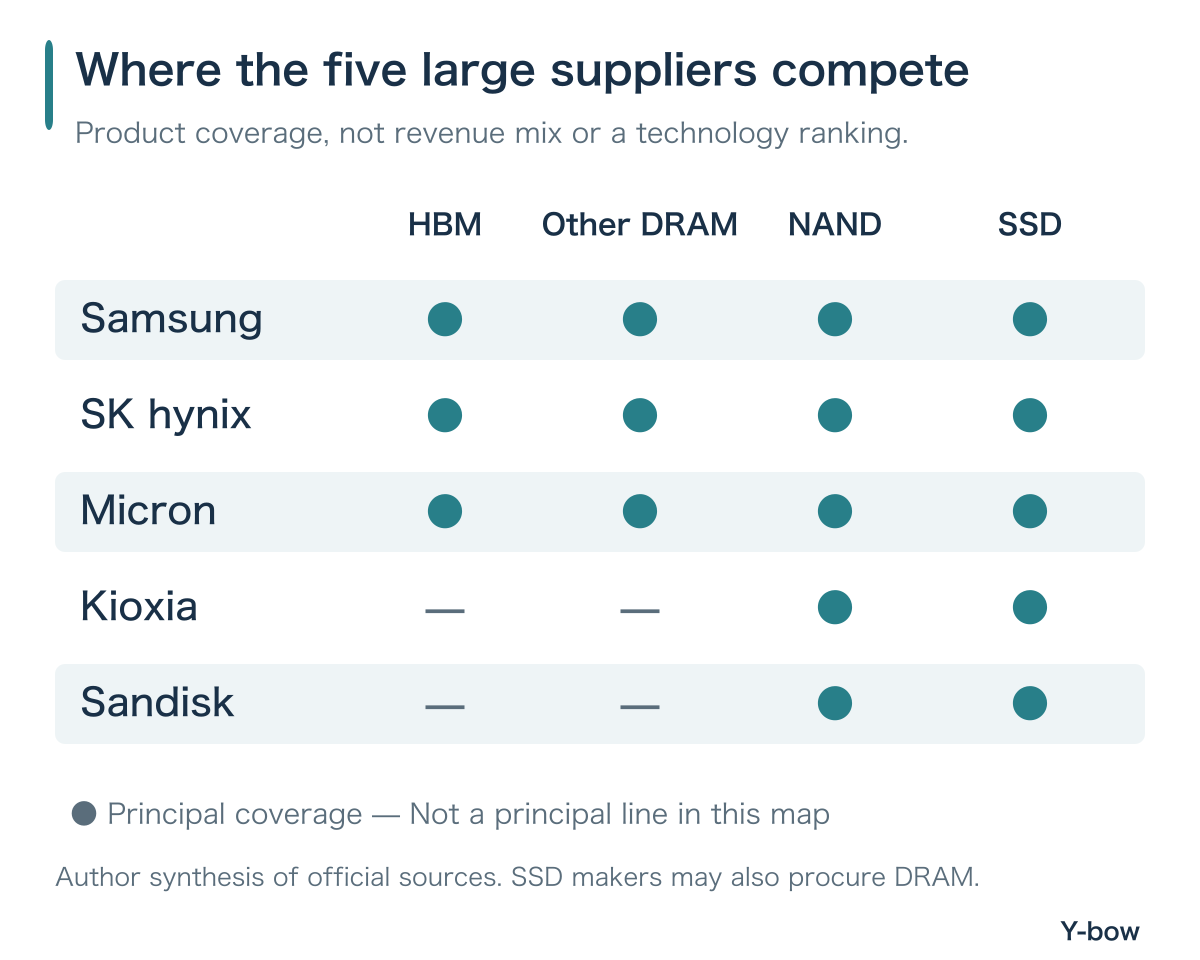
Samsung, SK hynix and Micron participate in both DRAM and NAND and are relevant comparisons in HBM. Kioxia and Sandisk are principally read through NAND and flash products. But a NAND-focused company can also buy DRAM for its finished products. Exposure is not limited to what a company manufactures internally.
Samsung: breadth, integration and the reporting-scope problem
Samsung combines memory with foundry, System LSI, devices and other businesses. Its April–June 2026 release describes expanding HBM4 sales and HBM4E sampling. Broad capabilities create options; they do not, on their own, prove superior execution at every customer and generation.
For an investor, the useful question is whether capability became customer adoption and profitable supply. A qualification headline needs a product generation, shipment scale and revenue timeline before it can become an earnings assumption. Equally, an HBM headline cannot describe all the other businesses in Samsung’s equity.
Read product mix and shipments alongside conventional DRAM pricing and non-memory performance. In particular, Device Solutions profit is not a standalone memory-profit disclosure. A table that labels DS margin “Samsung memory margin” creates false precision before the analysis begins.
SK hynix: follow HBM, conventional DRAM and the Solidigm connection
SK hynix combines HBM with DRAM, NAND and SSD exposure. Its April–June 2026 release reports the start of HBM4 mass shipments and long-term agreements with around ten customers. That does not mean every contract term or a fixed multiyear profit stream has been disclosed.
Solidigm is its U.S.-based subsidiary, operating in data-center and other SSD applications. When an industry study includes Solidigm within SK hynix Group, adding Solidigm again as an independent supplier double-counts the business.
I would track the HBM ramp, conventional DRAM pricing and volume, NAND/SSD mix, and cash after investment as separate lines. That makes it easier to see whether a strong quarter came from one scarce product or a wider set of improvements. Leadership also has to survive transitions: a position earned in one generation is not a perpetual entitlement to the next.
Micron: accessible U.S. equity is not a single-product exposure
Micron participates in DRAM, HBM, NAND and SSDs. Its FY2026 fourth-quarter release reports business units organized around customer applications. Cloud-related unit revenue should not automatically be relabeled HBM revenue.
Trading MU on a U.S. exchange does not mean every manufacturing, customer, currency or policy exposure is domestic. Investors still need to examine where capabilities sit and what investment is required. A compelling HBM thesis does not make the remainder of the product portfolio irrelevant.
Useful questions include application-level profitability, the respective effects of pricing and shipped bits, and the cash left after capacity investment. Compare GAAP with GAAP, and adjusted measures with an understanding of their reconciliations. A more favorable adjusted number does not become the only economically meaningful one.
Kioxia: NAND technology must become qualified products and usable output
Kioxia is primarily a NAND-and-flash-products business. Its CBA technical explanation describes making cell arrays and CMOS circuitry on separate wafers and bonding them. The competitive issue extends beyond stacking more layers: it includes how the design improves performance and cost.
A process announcement needs several more steps before it belongs in an earnings forecast. How much good output can it deliver? Which customers qualify the resulting product? What price and cost are achievable? Development, samples, qualification, volume production and recognized revenue are separate milestones.
In March 2026, Kioxia announced an investment in Nanya and a long-term DRAM supply agreement to support SSD component supply. That is not evidence that Kioxia became an HBM manufacturer. It illustrates a more useful industry map: suppliers can compete in one category and depend on other memory suppliers for components.
Sandisk: joint manufacturing does not make it the same investment as Kioxia
Sandisk separated from Western Digital in 2025. Historical Western Digital references need to be interpreted in their period; the old name is not a safe shortcut for current NAND equity exposure.
Kioxia and Sandisk collaborate in development and manufacturing, but remain distinct businesses with different customer mixes, products, financial positions and valuations. Their August 2026 announcement describes more than $31 billion of anticipated Japanese investment through 2032, contingent on government support, and the extended Yokkaichi framework through 2034. The announced amount is not all immediate new supply.
Do not describe their shared manufacturing footprint as two entirely separate copies of the same factories. Conversely, if a revenue study measures the brands separately, retain that study’s definition. Sandisk’s FY2026 Form 10-K is a useful source for joint-venture dependencies and funding obligations, rather than treating the partnership as free capacity.
DRAM and NAND market share: define the denominator before ranking companies
“Number one in memory” is incomplete. Does it mean all DRAM, HBM, NAND, SSD revenue, shipped bits or devices? A ranking can change when the denominator changes without either underlying dataset being wrong.
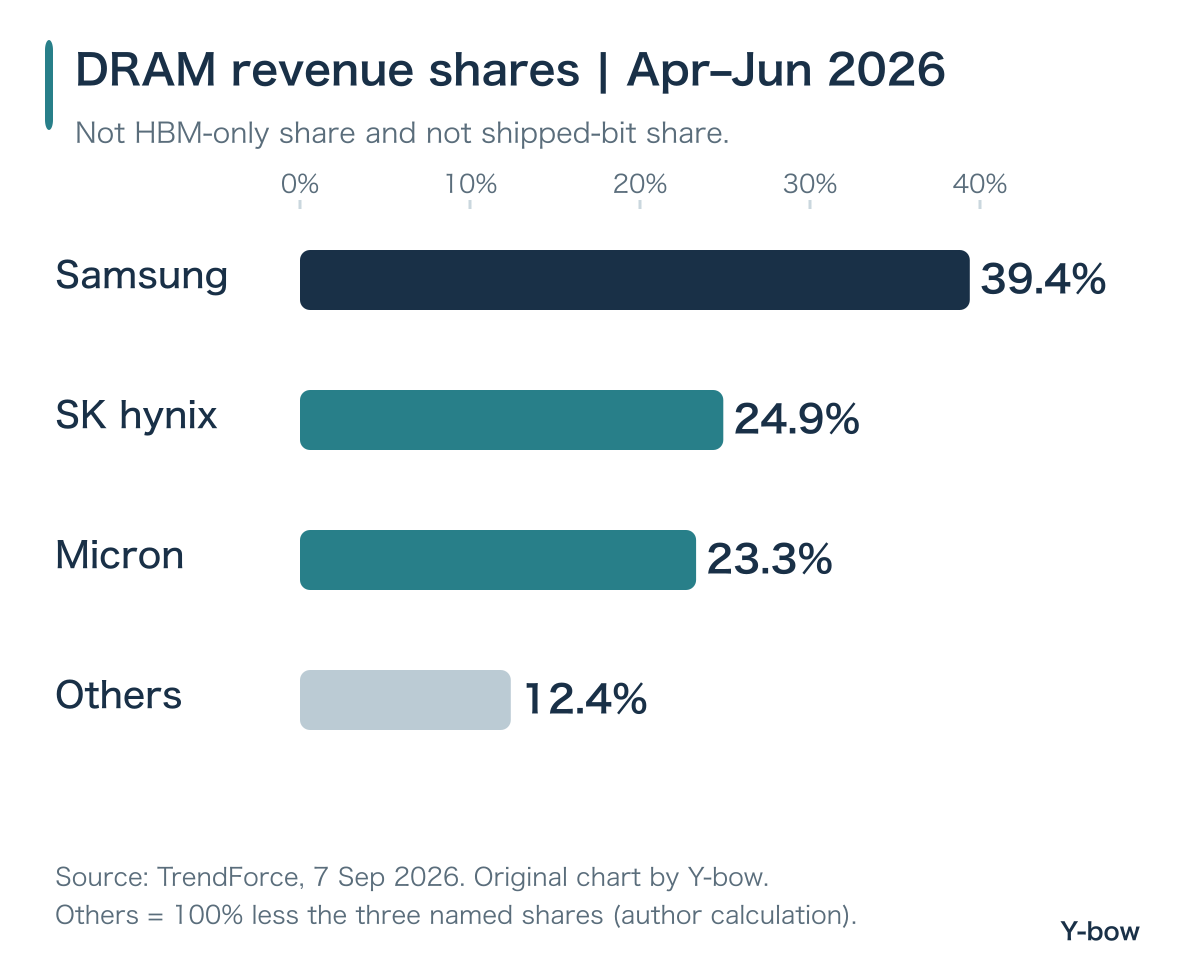
TrendForce’s April–June 2026 DRAM study reports revenue shares of 39.4% for Samsung, 24.9% for SK hynix and 23.3% for Micron. The chart’s remaining 12.4% is the author’s arithmetic remainder. These are not HBM-only shares or wafer shares.
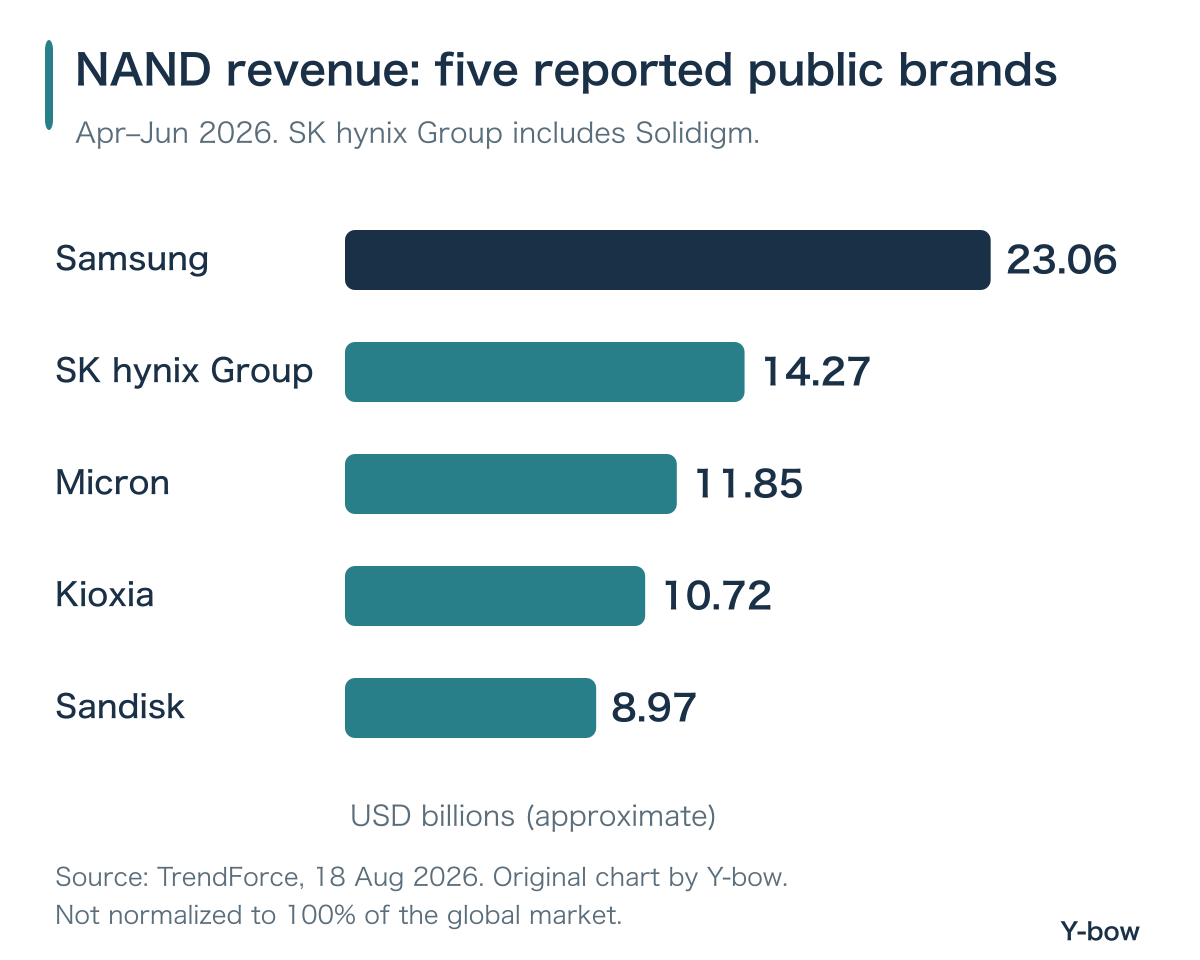
The NAND study places the five reported public brands in the order Samsung, SK hynix Group, Micron, Kioxia and Sandisk by revenue. This chart compares reported revenue estimates. It does not normalize those five suppliers into 100% of the world or erase competitors such as YMTC.
Falling share can coexist with rising revenue
Imagine total market revenue rising from 100 to 150 while one supplier grows from 30 to 40. That supplier grows revenue by 33.3%, but its share falls from 30% to 26.7%. Neither “share fell, therefore the business shrank” nor “revenue rose, therefore it won competitively” follows.
Premium products can also produce different revenue-share and bit-share trends. Profit share adds costs and investment requirements. The useful chain is volume, selling price, product mix and profit—not a ranking taken out of context. This distinction matters especially when AI-related products have a different value per bit from mature products.
YMTC, CXMT, Nanya and Winbond: competition outside the largest suppliers
| Company | Scope in official materials | What to investigate |
|---|---|---|
| YMTC | 3D NAND and Xtacking. | Production, adoption, served markets, equipment and policy constraints. |
| CXMT | DRAM including DDR and LPDDR products. | Generation, qualification and actual supply; do not equate these with volume HBM. |
| Nanya | DRAM. | Price versus volume effects, transitions and component-supply roles. |
| Winbond | Specialty/mobile DRAM and code-storage flash, among other products. | Application requirements, quality and supply continuity. |
It is unhelpful to dismiss Chinese suppliers as irrelevant or treat a product announcement as proof that every manufacturing and customer hurdle has disappeared. Designing a product, manufacturing it economically, qualifying it and supplying it repeatedly are different achievements. Trade controls and customer eligibility can change; current official rules need to be checked for a specific transaction.
Taiwanese suppliers should not all be judged by the leading-edge HBM contest. Nanya’s April–June 2026 release, for example, reports sharply higher selling prices with flat bit shipments. That is a concrete illustration of earnings changing without volume growth, not proof that the pricing environment must persist.
For some products, qualification, supply continuity and application requirements matter more than the maximum advertised bandwidth. A smaller company is not necessarily a diluted version of a larger one. Before comparing valuation multiples, establish whether the companies are competing for the same customer budget.
AI memory demand beyond HBM: inference, NAND and enterprise SSDs
AI deployment needs somewhere to load models, hold working data and store results or source material. But memory demand is not a fixed multiple of user numbers. Model design, concurrency, context, quantization and reuse alter requirements. Doubling AI usage does not automatically double NAND purchases.
A simple sizing example helps. Storing 100 billion parameters at two bytes each requires 200 GB for weights alone, using decimal GB. At one byte it is 100 GB; at half a byte it is 50 GB. These are author calculations, not a benchmark or a complete model-deployment specification. Cache, working space, replication and other overhead are excluded. The design between model size and purchased capacity matters.
KV-cache tiering can help storage demand without making HBM obsolete
NVIDIA’s CMX technical article describes placing inference context across GPU HBM, host memory and storage tiers. This is a hierarchy designed around when and how data is needed, rather than a claim that everything belongs in the fastest tier.
My investment inference is that an SSD supplier’s opportunity depends on workload suitability, not just headline capacity. Read/write behavior, latency, endurance, power and software integration determine whether the product solves the customer’s problem. Adoption in one architecture does not establish universal substitution for HBM.
Likewise, SSD purchases need not map one-for-one to a specific supplier’s margin. The customer may choose a different product mix, demand qualification work or negotiate prices. An end-market story becomes an investable company thesis only after these intermediate steps are considered.
High Bandwidth Flash: distinguish a roadmap from current earnings
Sandisk’s HBF aims to extend flash into a high-bandwidth AI inference tier. Its 2026 technology presentation includes architectures combining HBF with HBM and a roadmap indicating inference-product samples in 2027.
That creates an option to investigate, not current commercial revenue to add to the income statement. Tape-out, samples, evaluation, production and profit are different stages. Track target workloads, customer validation, cost and commercial timing before replacing an existing industry model with a slogan that HBF will eliminate HBM.
Memory earnings analysis: compare revenue, operating profit and cash correctly
First identify the period, currency, accounting basis and business scope. The snapshot below is not a like-for-like ranking of manufacturing quality. Micron and Sandisk fiscal quarters do not coincide exactly with the calendar April–June quarter.
| Company and period | Revenue / operating profit | Margin and reporting scope |
|---|---|---|
| Samsung DS 2026-04-01 to 2026-06-30 | 127.500 / 89.200 KRW trillion | 70.0% K-IFRS, DS segment includes non-memory |
| SK hynix 2026-04-01 to 2026-06-30 | 79.319 / 60.543 KRW trillion | 76.3% K-IFRS consolidated |
| Micron Fiscal Q4 ended 2026-09-03 | 54.229 / 43.751 USD billion | 80.7% US GAAP consolidated |
| Kioxia 2026-04-01 to 2026-06-30 | 1,767.1 / 1,270.0 JPY billion | 71.9% IFRS consolidated |
| Sandisk Fiscal Q4 ended 2026-07-03 | 8.965 / 7.037 USD billion | 78.5% US GAAP consolidated |
Samsung subsequently issued preliminary consolidated July–September guidance on October 8: approximately KRW 195 trillion of sales and KRW 107.4 trillion of operating profit. These pre-audit group estimates cannot be mixed with the earlier DS results to manufacture a memory-only margin.
Operating profit and net income answer different questions
Operating profit reflects a different level of the income statement from net income, which includes financing, taxes and other effects. SK hynix’s reported quarter illustrates why the distinction matters: net income exceeds revenue. That is not a claim that ordinary memory manufacturing converts more than all its revenue into operating earnings. Read the reconciliation and statement details before assigning a cause.
Adjusted results require similar discipline. Different companies exclude different items, potentially including share-based compensation, acquisition accounting or litigation effects. Compare reported and adjusted measures with their definitions. Neither the higher number nor the more familiar label is automatically the right measure for every valuation question.
Separate bit shipments, average selling price and product mix
For a simplified single product group, revenue equals shipped bits times price per bit. A 10% increase in volume and 20% increase in price produces 1.1 × 1.2 = 1.32, or 32% revenue growth, not 30%. At a real company, mix and foreign exchange add complications, so this is a bridge for thinking rather than a complete earnings reconstruction.
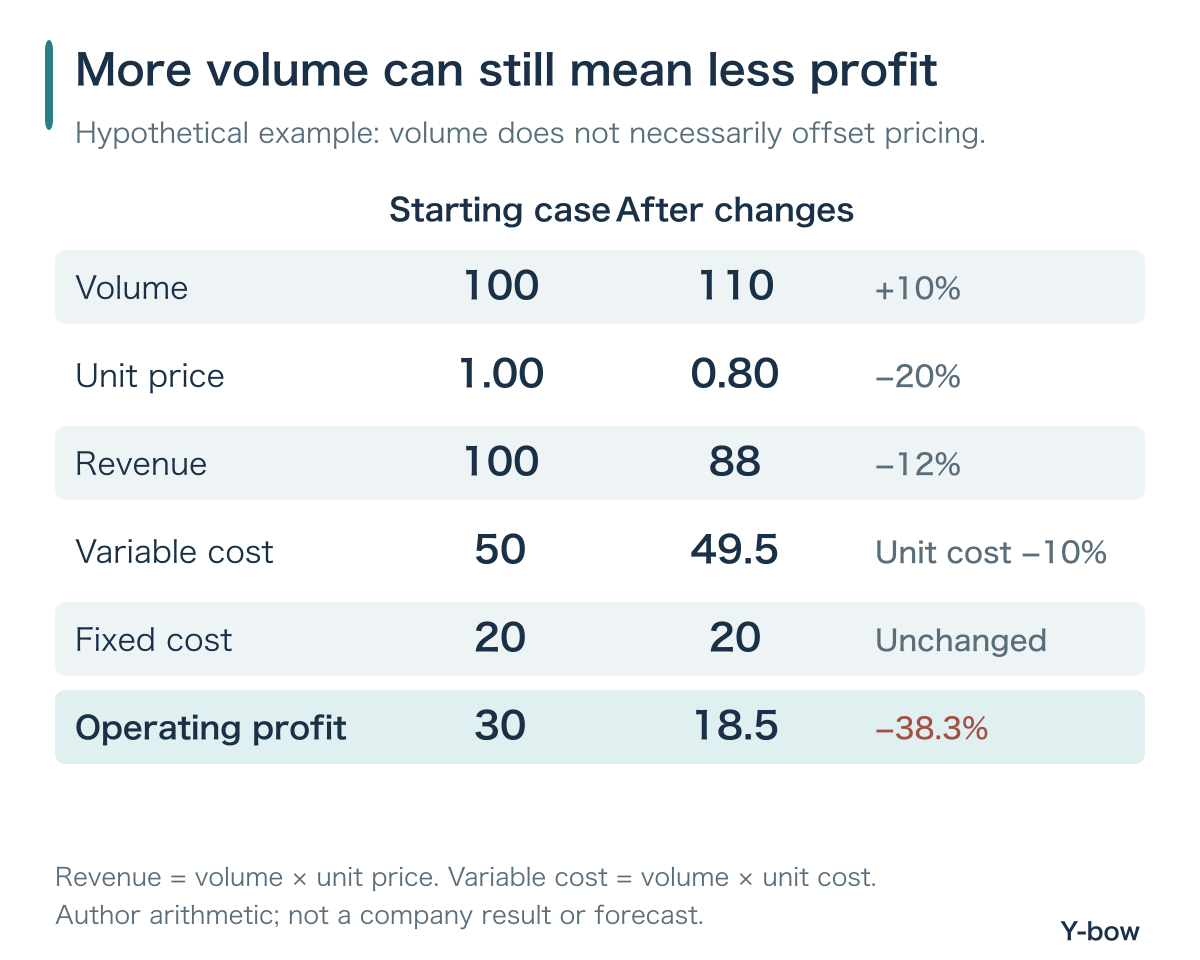
Our hypothetical starting business has revenue of 100, variable costs of 50, fixed costs of 20 and operating profit of 30. In the second case, volume rises 10%, selling price falls 20%, and variable cost per unit falls 10%. Revenue becomes 88, variable costs 49.5 and operating profit 18.5. Profit falls 38.3% despite more output and cheaper production per unit.
Actual inventory accounting, utilization and depreciation are more complex. Still, the example shows why “more bits means more profit” is incomplete. A new process can incur expense before usable yield improves; cash investment can precede the depreciation that eventually enters earnings.
Cash after capital expenditure: what remains for shareholders?
Rising earnings need not become equally rising cash if receivables or inventory absorb funds. Operating cash flow less capital expenditure is a useful starting calculation, but it may differ from a company’s adjusted free-cash-flow definition. Examine grants, customer advances, joint-venture payments and payment timing.
A large cash balance also needs obligations attached to it: committed investment, debt maturities, distributions and operating needs. Customer funding can reduce financing pressure while bringing delivery obligations. Counting incoming cash as freely distributable wealth without those commitments would miss part of the economics.
Buildings, production equipment, packaging, testing and development are not identical sources of new bit supply. Equipment installation is not customer qualification. The practical question is how much saleable, qualified output can be delivered, at what cost, and when.
Is the memory cycle different now? Supply constraints and expansion still matter
HBM involves stacking, interconnects and thermal requirements as well as DRAM. The SK hynix–TSMC collaboration announcement explains the roles of base dies and packaging. Memory suppliers, logic foundries and packaging technologies participate in the same system without becoming interchangeable companies in a DRAM share table.
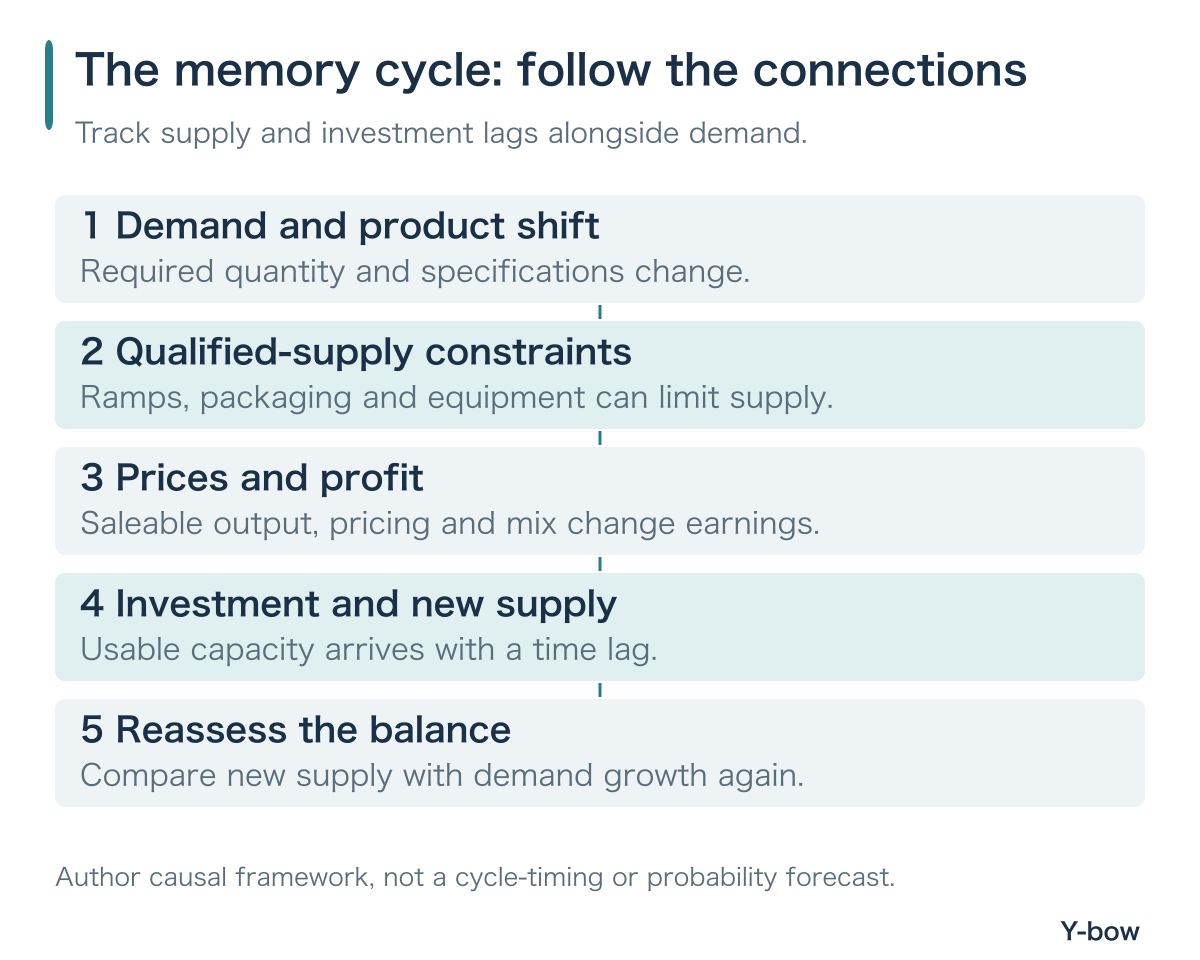
When demand rises faster than qualified supply, suppliers may gain bargaining power. Strong profits then encourage investment. If new usable capacity arrives together while demand growth slows, prices can face pressure. This is a causal framework, not a forecast that a particular month will mark the next downturn.
Long-term agreements need terms, not just a reassuring label
Ask about the product, duration, volume, price-reset mechanism, minimum purchases, advances and collateral. If these terms are not public, leave them unknown. A supplier expecting durable demand is different from investors having a fully disclosed, fixed future profit stream.
Contracts can support investment while increasing dependence on a few customers. Technology transitions can change which equipment and products remain useful. Contract renewal, customer bargaining power and the cost of the next generation belong in the same analysis as the original agreement.
Efficiency and new architectures can change demand without a simple yes-or-no outcome
Memory per task may fall while the number of tasks, concurrent users or model sizes increases. Total demand may therefore rise—but it is not guaranteed that usage growth will always exceed efficiency gains. Track the workload, its placement across tiers and the customer’s economic return.
I would also separate two explanations for strong supplier earnings: new underlying demand and pricing power caused by slow supply response. Both can generate profit, but they have different failure conditions. Writing the profit driver next to each company makes the industry map more useful than a static list of winners.
Memory stock valuation: why a low P/E at peak earnings can mislead
A price of 1,000 and EPS of 100 means a P/E of 10. If sustainable EPS is instead 50, the same price represents 20 times earnings. At the other end of a cycle, depressed or negative current earnings can make a P/E high or unusable without proving the company is expensive.
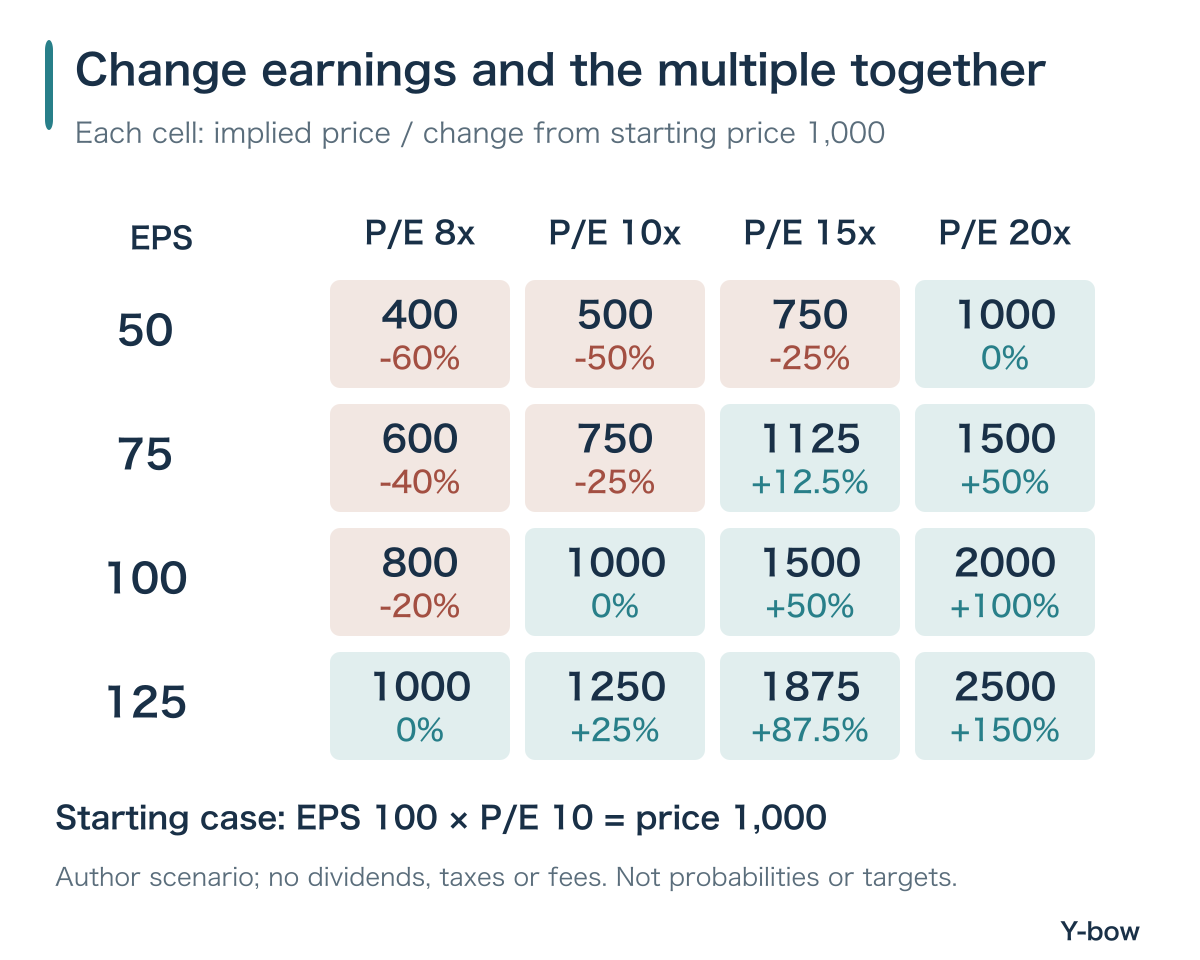
The figure starts with EPS 100 × P/E 10 = price 1,000. If EPS falls to 50 and the multiple rises to 15, price becomes 750: 25% below the starting value. A larger multiple need not offset an earnings decline. The cells contain arithmetic outcomes, not probabilities or price targets.
Try different assumptions for normalized prices, mix, unit costs and share count. Then consider cash, debt and future investment. Buybacks change share count and capital allocation but do not substitute for an operating thesis; see our analysis of memory-company buybacks and index flows.
For international investors, the trading instrument adds another layer. Verify the exchange, actual listing or depositary-receipt terms, liquidity, currency exposure, fees and tax treatment rather than assuming a U.S. ticker or a company name guarantees equivalent access. A business comparison is not a substitute for checking the security available in your jurisdiction.
Hold, add or reduce? Build a testable memory-investing checklist
The research cannot reveal tomorrow’s closing price. It can improve the questions you ask before changing your position. I would separate three records rather than ask one optimistic industry narrative to do all the work.
| Record | Write down | Avoid |
|---|---|---|
| Business assumptions | Product, customer, adoption, pricing and margin drivers. | Filling every blank with “AI growth.” |
| Valuation assumptions | Normalized earnings, multiple, shares, cash and commitments. | Treating industry growth as a stock-return forecast. |
| Household constraints | Cash deadlines, concentration and further loss in money. | Using company quality to justify a funding shortfall. |
If holding: describe the current reason, not just the entry price
“Wait until it comes back” does not define a deadline or an alternative if it does not. Check whether qualification, actual supply, costs and investment still support the expected earnings path. Look deliberately for conflicting evidence. Holding is a fresh decision about where today’s remaining capital belongs.
If adding: measure the shared exposure across different tickers
Micron, SK hynix, Kioxia and a semiconductor ETF may all depend on AI capital spending or memory pricing. More securities do not necessarily mean more independent risks. A position can become more concentrated even while its number of line items increases.
A lower purchase price may reduce the average entry price, but adding capital increases the amount at risk. If the shares are 20% cheaper while a reasonable sustainable-earnings estimate is 40% lower, the investment is not automatically a better bargain. Ask why the additional money belongs there now, rather than how to recover an earlier loss.
If reducing: distinguish a broken thesis from an oversized position
A delayed ramp, changed customer adoption, weaker pricing or larger investment requirements can warrant a revised thesis. Separately, household spending or debt can require less exposure even when the company remains strong. Neither situation is adequately described as a lack of conviction.
For a practical cash-and-position worksheet, use our five checks before panic selling. Industry knowledge and a manageable allocation solve different parts of the decision.
| Area | Evidence | Question |
|---|---|---|
| Price and volume | ASP, shipped bits, application revenue. | Is growth price-driven, volume-driven or both? |
| Premium products | Qualification, production and sales milestones. | Did an announcement become revenue? |
| Supply | Utilization, transitions and investment. | When does usable output actually arrive? |
| Cash | Operating cash, equipment payments, working capital, debt. | What remains after obligations and investment? |
| Competition | Alternative products and customer sourcing. | Has adoption or bargaining power changed? |
| Valuation and exposure | Price, shares, earnings assumptions and portfolio holdings. | Have expectations or concentration increased? |
Memory industry FAQ
Are Kioxia and Sandisk HBM manufacturers?
Their principal businesses considered here are NAND and flash products. Do not relabel HBF development or DRAM procurement partnerships as current HBM manufacturing revenue.
Which is strongest: Samsung, SK hynix or Micron?
Specify the product, customer, generation and metric first. Leading total DRAM revenue does not establish leadership in every HBM product. The strongest business is also not automatically the cheapest stock.
Does growing HBM demand guarantee higher NAND prices?
No. Production-resource allocation and common customer demand can connect markets, but each product has its own supply, demand and cost. An HBM shortage percentage cannot calculate a NAND price increase.
Should TSMC be added to DRAM supplier market share?
Not in this framework. It appears as a foundry and packaging collaborator in the HBM ecosystem, rather than another DRAM supplier whose revenue can simply be added to that market.
Why can a memory stock fall after record earnings?
Expectations may have been stronger; investors may worry about future pricing, investment or valuation multiples. These are possible mechanisms, not a definitive attribution for an individual day’s move. Separate reported results from the expectations paid for in the stock price.
Read the chain: product, customer, earnings, then price
Even on an HBM-heavy news day, a NAND supplier should be evaluated through its own pricing, shipments, adoption and costs. A broad memory company needs conventional DRAM, SSDs and investment cash flows alongside its HBM story. Define company relationships and data denominators before drawing the comparison.
An industry map is useful when it helps you update a thesis, including the conditions under which you would reduce exposure. It is less useful as a permanent roster of winners. The aim is not to eliminate uncertainty, but to replace a vague conviction with facts and assumptions you can revisit.
Related infrastructure constraints are covered in our guides to AI data-center power demand and water consumption, WUE and cooling. The author’s Japanese-language note publication contains company-specific earnings discussions, including fully free articles and partly paid analyses; access terms are shown on each article.
Sources, methodology and updating the map
- Kioxia multilevel-cell technology explanation
- SK hynix 2Q26 results, July 29, 2026
- Samsung 2Q26 results, July 30, 2026
- Samsung 3Q26 preliminary guidance, October 8, 2026
- Micron FY2026 Q4 results, September 30, 2026
- Kioxia April–June 2026 IFRS results, July 31, 2026, pp.1, 3–4, 9
- Sandisk FY2026 Q4 results, August 5, 2026
- TrendForce DRAM revenue research, September 7, 2026
- TrendForce NAND revenue research, August 18, 2026
- Solidigm official company and product FAQs
- Kioxia–Sandisk investment plan, August 27, 2026
- Kioxia investment in Nanya and DRAM supply agreement, March 25, 2026
- Nanya 2Q26 results, July 10, 2026
- Kioxia CBA technical explanation
- Kioxia NAND flash technical explanation
- Micron HBM4 product page
- SK hynix–TSMC HBM collaboration, April 19, 2024
- YMTC official company profile
- CXMT official product portfolio
- Winbond specialty-memory product scope
- Sandisk separation FAQ
- NVIDIA CMX context memory technical article, March 16, 2026
- Sandisk 2026 technology and HBF roadmap, pp.10, 14, 20
- Sandisk FY2026 Form 10-K, SEC filing
- Kioxia IR calendar and official news
TrendForce figures are its research estimates and may not match company accounting or shipped-bit definitions. Company performance and roadmap claims have not been independently benchmarked here. Product-coverage diagrams are not technology rankings or future-share forecasts. Hypothetical calculations omit taxes, trading costs and dividends and assign no probabilities. This article is general education, not individualized investment or tax advice.








Comments