
SOXL offers a simple headline: three times the daily move of a semiconductor index. The difficulty is in the words “daily” and “index.” Neither means three times a favorite chipmaker’s earnings growth, or three times the index’s return over a year.
Semiconductor demand can grow while semiconductor shares fall. A strong business outlook may already be reflected in valuations, and different chip businesses have different customers, margins and capital needs. Adding leverage makes those distinctions more consequential.
Here is a practical way to read SOXL’s objective, calculate a short holding period and translate a fund loss into a portfolio loss.
What SOXL tracks today
Direxion Daily Semiconductor Bull 3X Shares, ticker SOXL, targets 300% of the NYSE Semiconductor Index’s daily performance before fees and expenses. It is a daily objective and is not guaranteed. The current benchmark is not the older semiconductor index name found in some historical articles. Source: Direxion product page.
The index represents semiconductor-related equities. It is not a direct investment in industry sales, semiconductor manufacturing capacity or every company benefiting from artificial intelligence. Index rules, constituent weights and rebalancing determine the exposure.
That matters when a specific company reports results. Even an exceptional earnings surprise affects a diversified benchmark only through that company’s weight and the response of other constituents. A Korean or Japanese memory company’s share price may not be a direct SOXL holding at all. Check the current issuer list before assuming otherwise.
Why daily 3x is different from three times a long-term gain
Use a frictionless model that exactly achieves its daily target. Let the index rise 5% on day one, then fall by 4.76190476% on day two. The second move returns the index to its starting point.
| Step | Index | Ideal daily 3x model |
|---|---|---|
| Start | 100.00 | 100.00 |
| Day 1: index +5% | 105.00 | 115.00 |
| Day 2: index −4.7619% | 100.00 | 98.57 |
The index is unchanged over the two days. The model is down about 1.43%, before costs. Its second-day loss is calculated from 115, not from the original 100.
This does not mean compounding always hurts. Two consecutive +5% index days produce an index gain of 10.25% and a daily 3x model gain of 32.25%, above three times 10.25%. The daily returns and their combined variation matter. Merely rearranging the same set of daily returns does not change their compounded product in this simplified model.
The SEC explains why leveraged ETF returns over longer periods can diverge materially from the daily multiple. Actual costs and imperfect tracking make a real fund more complex than these calculations. Source: SEC.
Drawdown recovery: a large percentage gain may still be insufficient
If a holding falls 60%, 100 becomes 40. Recovering from 40 to 100 requires a 150% gain. After an 80% loss, the required gain is 400%.
This is arithmetic, not a prediction of SOXL’s next decline. It is useful because a return headline can sound more reassuring than the remaining account balance. A 100% rebound after an 80% loss leaves the investor at 40, still 60% below the starting value.
| Loss | Value remaining from 100 | Gain required to return to 100 |
|---|---|---|
| 20% | 80 | 25% |
| 40% | 60 | 66.7% |
| 60% | 40 | 150% |
| 80% | 20 | 400% |
Position sizing: translate SOXL risk into portfolio dollars
A small allocation to a volatile fund is not the same as putting the whole account into it. If all other assets are unchanged, the direct portfolio return contribution equals the position weight times its return.
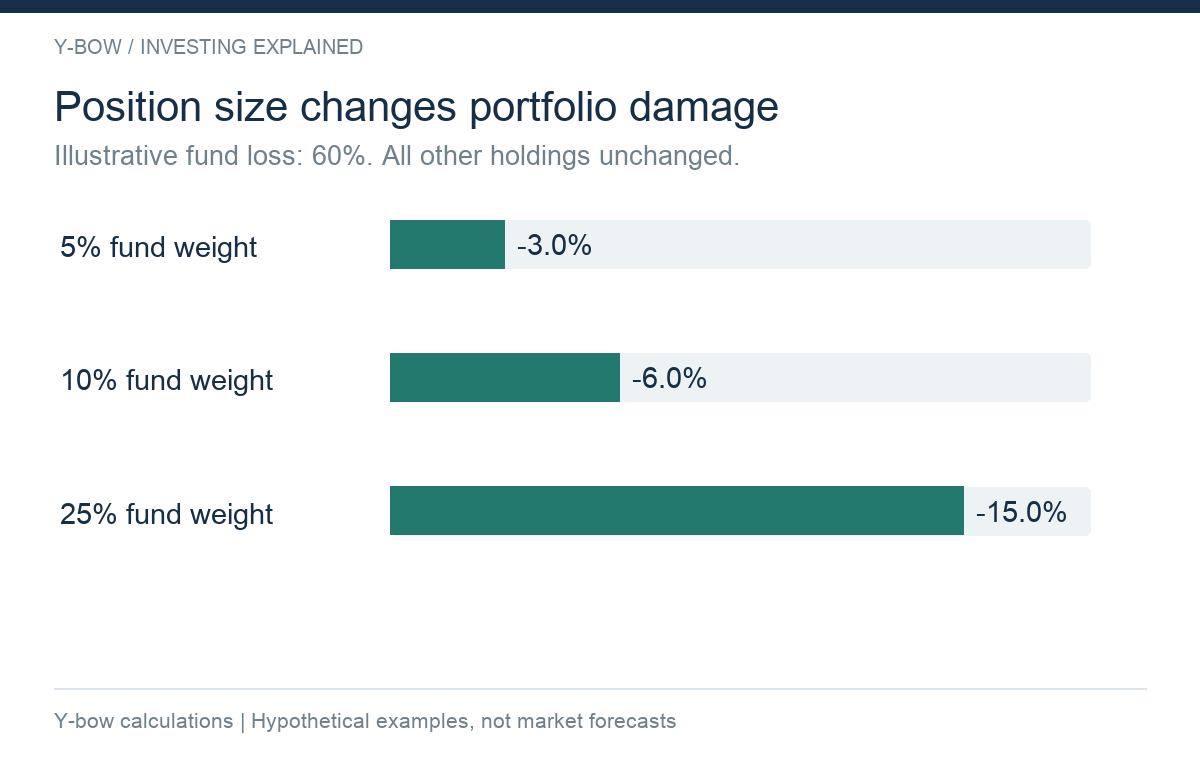
For an illustrative 60% fund loss, a 5% starting weight costs the portfolio 3%, a 10% weight costs 6%, and a 25% weight costs 15%. The calculation uses starting weights and no rebalancing or cash flows.
Other assets are unlikely to remain perfectly unchanged in a real shock. A portfolio containing a semiconductor fund, a Nasdaq fund and individual chip stocks can have substantial overlapping exposure. Count the underlying companies and risks, not just the number of holdings.
An initial 10% SOXL allocation also represents roughly 30% of portfolio value in its targeted daily index exposure, before considering the other holdings. That is not an exact multi-day beta or a guarantee of portfolio performance. It is a useful warning that the capital allocated and the intended daily market exposure are different quantities.
Expenses, financing and trading costs
The stated expense ratio is only one item to read. Leveraged exposure uses instruments such as swaps and may involve financing costs, trading costs and tracking differences. Read the current prospectus and footnotes; do not assume every economic cost fits inside a single headline percentage.
An investor also encounters a bid-ask spread and possibly commissions, currency conversion and taxes. Frequent trading can make those costs more important. A performance calculation should identify whether it uses market prices or net asset value and whether distributions are reinvested.
A cash purchase of SOXL is different from borrowing from a broker to buy it. The fund’s internal leverage does not by itself create the same personal margin obligation as a margin loan. Buying the fund with borrowed money adds a separate layer of leverage, interest and possible forced liquidation. See margin loans and daily-reset funds.
Is SOXL suitable for a long holding period?
There is no answer based only on the phrase “semiconductors will grow.” The investment would need a view on share valuations, the path of daily returns, the cost of exposure, position size and the investor’s ability to tolerate losses.
A long historical chart is not enough if its start date excludes a difficult period, or if simulated pre-inception data are presented as actual fund performance. Backtests should state assumptions and show adverse paths, not just the most attractive terminal value.
Money needed for rent, a house purchase or tuition on a fixed date has a different job from speculative capital. A plan that depends on selling SOXL profitably at that date leaves the bill exposed to both industry risk and leverage.
What to check before using a semiconductor leveraged ETF
Read the current benchmark and holdings. Understand the daily reset. Calculate an adverse loss in dollars and as a share of the whole portfolio. Check overlap, costs and the effect of any personal borrowing. Decide what would cause you to reassess the position.
Compare that proposal with an unleveraged semiconductor allocation and with a broader equity portfolio. The right comparison is whether the extra exposure serves a defined purpose at an affordable risk, not whether the fund’s name matches a promising technology story.
Information checked October 15, 2026. Figures are original hypothetical calculations rather than SOXL performance or forecasts. No personal investment allocation is recommended.








Comments