

A company can build useful products, grow a business and still deliver a disappointing investment return at the wrong purchase price. That is the starting point for assessing Tesla—not whether electric vehicles, batteries or autonomous systems are interesting.
Calling a stock a “bubble” often ends a discussion that should be more specific. What earnings, cash generation and future businesses are already reflected in the price? What would have to happen for a buyer to earn an acceptable return? This guide turns those questions into a valuation checklist.
Start with Tesla's reported results, then add the future story
Tesla's 2025 Form 10-K reports the following figures. They are historical full-year results, not estimates of 2026 performance. Amounts below are U.S. dollars in billions, rounded to three decimal places.
| Reported measure | 2024 | 2025 |
|---|---|---|
| Total revenue | 97.690 | 94.827 |
| Total automotive revenue | 77.070 | 69.526 |
| Energy generation and storage revenue | 10.086 | 12.771 |
| Net income attributable to common shareholders | 7.091 | 3.794 |
The table shows why one growth label is insufficient. Energy revenue increased while total and automotive revenue fell. Net income changed differently again. A valuation must account for the mix rather than extrapolating the most attractive line across the whole business.
The Tesla investor-relations page provides subsequent quarterly reports. Read those before making a current decision; this article's annual comparison deliberately retains a clear measurement period.
Business growth and stock returns are not the same calculation
Consider a fictional company earning $2 per share, trading at 50 times earnings. Its price is $100. Earnings rise 50% to $3, but the market's valuation multiple falls to 30. The new price is $90, a 10% loss before distributions.
The business improved under the chosen earnings measure. The buyer still lost money because the starting price assumed a higher multiple. This is arithmetic, not a Tesla earnings forecast or price target.
| Fictional future earnings per share | At 20x earnings | At 30x | At 40x |
|---|---|---|---|
| $2 | $40 | $60 | $80 |
| $3 | $60 | $90 | $120 |
| $4 | $80 | $120 | $160 |
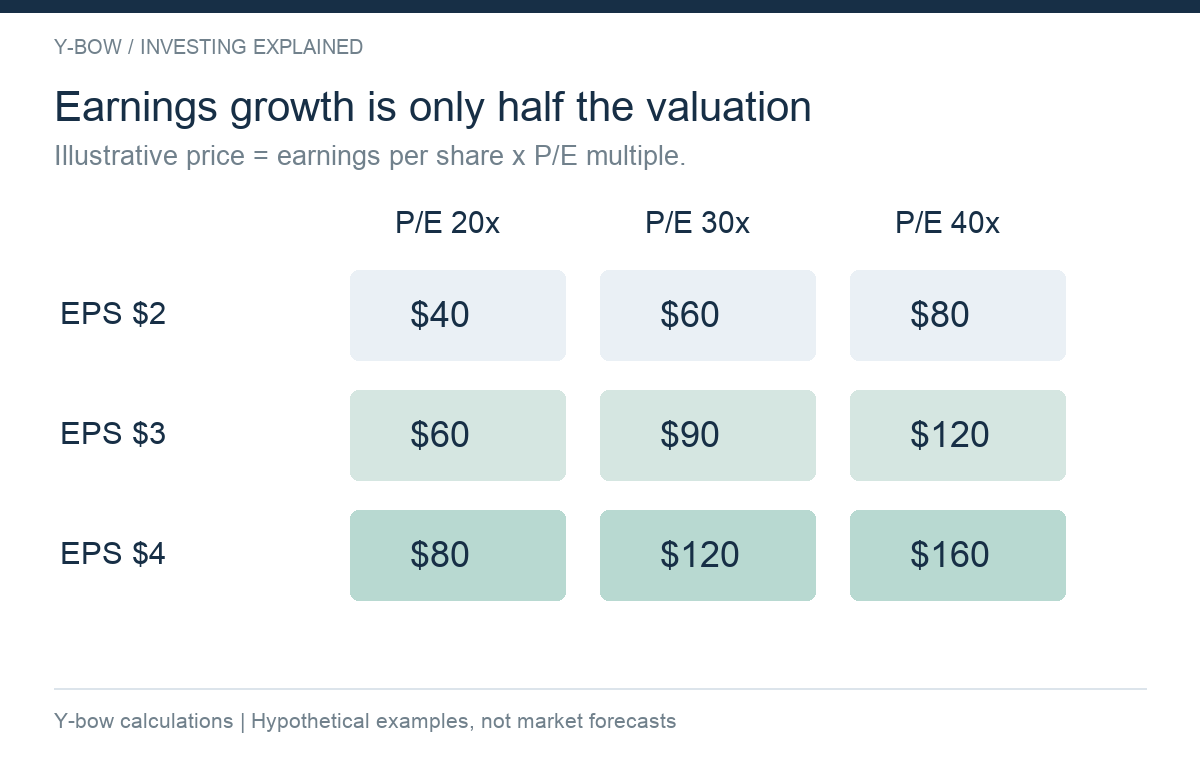
The range is useful because it makes two assumptions visible: future per-share earnings and the price investors will pay for them. A single price target hides that dependence unless its assumptions are disclosed.
Keep automotive, energy and speculative opportunities separate
For automotive operations, ask about sales volume, selling prices, production costs, warranty obligations and the cash required to maintain capacity. More deliveries can coexist with less profit per vehicle.
For energy storage, examine revenue conversion into gross profit, working capital and investment requirements. A faster-growing segment can deserve attention without immediately making the rest of the company irrelevant.
For autonomy, software and robotics, distinguish a demonstrable business from a scenario. State what must happen: technical performance, regulatory permission, customer willingness to pay, capital requirements and timing. A product demonstration does not by itself establish recurring cash flow attributable to common shareholders.
These are analytical questions, not claims that a future product will succeed or fail. The discipline is to avoid counting the same prospective revenue in several parts of a valuation.
Revenue, earnings and cash flow each reveal something different
Revenue measures sales recognized under the accounting rules. Earnings include expenses and other items under those rules. Operating cash flow also reflects changes in working capital; capital expenditure then uses cash to build or maintain assets.
If a business needs substantial reinvestment, rising earnings do not automatically mean the same amount is available to owners. Conversely, one unusual accounting item can change a year's net income without describing the recurring economics.
Read the reconciliation and footnotes before comparing adjusted and GAAP measures. Keep stock-based compensation and the resulting share count in view. The relevant question for a shareholder is not just “Did the company become bigger?” but “What happened per share?”
Adjust historical Tesla stock charts for splits
Tesla's investor-relations archive records a five-for-one split in 2020 and a three-for-one split in 2022. Together, those splits turn one pre-split share into fifteen shares, ignoring any other transactions. They do not multiply the shareholder's ownership percentage by fifteen.
For an invented illustration, one share at $1,500 becoming fifteen shares at $100 leaves a $1,500 position at the split instant. Comparing the old unadjusted $1,500 with the later $100 would falsely suggest a severe investment loss.
Use consistently adjusted data when discussing a ten-year price change. Check whether a chart also adjusts for distributions and whether its starting point precedes a major corporate action. A visually steep curve is not a substitute for those labels.
Market capitalization is not the value of the operating business alone
Equity market capitalization is price multiplied by the relevant share count. An enterprise-value comparison also considers financing claims and cash, under a stated convention. Comparing two companies using different definitions can produce a misleading ranking.
A current market cap also needs a current price and dated share count. This article does not publish a live P/E or price target, because those would require updating the numerator, denominator and earnings period together.
For a practical worksheet, enter the observation date, share price, diluted earnings period, share count, debt and cash. Mark assumptions clearly. Do not quietly switch between trailing earnings, next year's consensus and a distant successful-business scenario.
What would make you change your view?
Write a short case that can be checked against future disclosures. “Energy margins improve while investment remains affordable” is more testable than “Tesla will change the world.” “This valuation requires a large future contribution from an unproven business” is more precise than “It is obviously a bubble.”
Then identify what could contradict your case. Lower unit economics, a delayed commercialization schedule, a rising share count or larger funding needs may matter even if the overall technology story remains appealing.
Position size belongs in the same exercise. A modest individual-stock allocation and a portfolio dependent on one outcome are different decisions. Owning a broad index that includes a company is also different from choosing to overweight that company.
Tesla valuation checklist
| Question | Useful evidence |
|---|---|
| Which results are reported? | Dated annual and quarterly filings |
| Which part is an assumption? | Explicit sales, margin, timing and capital inputs |
| What changes per share? | Earnings, cash generation and diluted share count |
| How much success is already priced? | More than one earnings-and-multiple scenario |
| Can the household absorb failure? | A stated allocation and loss budget |
I find this process more useful than trying to settle the word “bubble.” It produces a claim you can revisit when facts change, while keeping admiration for a business separate from the price of its stock.
Sources checked October 15, 2026. The matrix and figure are original hypothetical Y-bow calculations and are not Tesla forecasts. Reported financial figures refer to 2024 and 2025; subsequent developments are not inferred from them.









Comments